
New
It seems like there’s a new security product every day. And we’re continually adding network, endpoint and SIEM technologies to our integration list based on customer input. In this release, we’ve completed our integration with our first deception vendor, Attivo Networks, and our first network detection and response vendor, ProtectWise. We’ve also expanded our Palo Alto Networks investigation capability.
Clearer workflow for investigating alerts
We’ve simplified your options for investigating alerts, to — Close, Add To and Investigate.
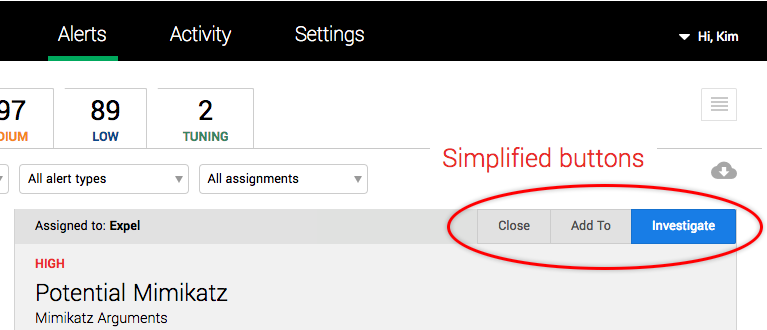
Use the Close button to (you guessed it) close an alert. Now, when you close an alert, you can specify if it’s a false positive or something else. You can also include a comment to provide more context for your decision.
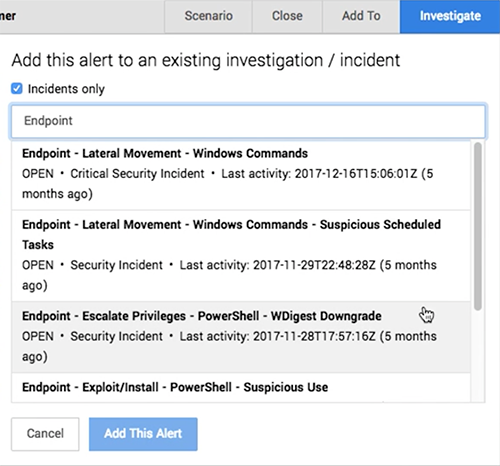
Use the Add To button to add an alert to an existing investigation or security incident. To help you find the right investigation or incident, we’ve provided some new functionality:
- Click Incidents to filter the list so it just shows security incidents.
- Use the Search field to search for investigations and incidents by name.
- The summary information below the name provides details about the incident, including if it’s open or closed and how recent it is.
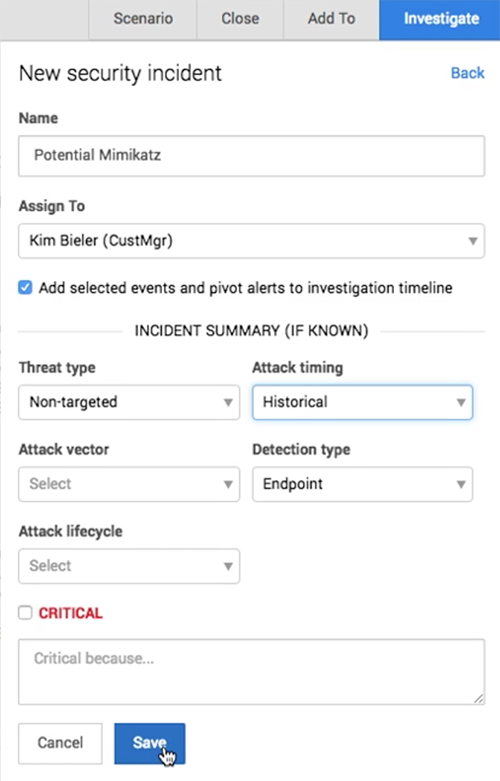
Use the Investigate button to create a new investigation or security incident from the alert. For investigations, you can change the name and assign someone as the lead investigator. Click This is a security incident to switch forms and create a new security incident. If you know something about the incident based on the alert, you can also apply summary tags at the same time you’re creating the incident to provide more detail in the notification email about the new incident.
More investigative capabilities
- If you have Attivo or ProtectWise, great news, Workbench™ now includes detection capability for these products.
- Calling all Palo Alto Networks users, we’ve added three new investigative actions: Query IP, Query domain, and Query netflow.
Other UI enhancements
- The Situation report dashboard now includes a custom date range field for the Activity metrics pie charts (mmm pie), so you can pick any date/time range you like.
- Table for one. If there’s only one security device that will perform a particular investigative action, the UI will select it automatically.
- We’ve added a time range selector to the Alert detail > Involved hosts tab. You can now filter the related incident by a selected time range (past 24 hours, past 7-, 30-, and 90-days).
- The Data Viewer received a mini makeover, we’ve added new fields, renamed a few fields and re-ordered the columns.
- In the Alerts Grid, if you filter by Type and select a whole category (for example, Endpoint), the filter token now displays the category name instead of listing the devices in that category.
- We’ve made it easier to see what’s going on when we’re hunting. We now include information about the size of the initial results set before we apply the analytical filter, in the findings report.
- We’ve improved the health messages for security devices to make it easier to identify and fix configuration problems. (Thanks WebMD, but we’ve got this!)
- The Download CSV function on the Alerts page now includes a checkbox to include vendor alerts in the exported file. The CSV file will now also identify which alerts were the initial lead in an investigation or security incident.
Performance enhancements
- We’ve improved how we onboard devices that integrate via SIEM. Now Workbench automatically starts collecting events from these devices.
- We did a little spring cleaning and created a maintenance process that will automatically clean up duplicate or unwanted SIEM queries on the back end.
- Can you see me now? We’ve improved how we monitor alert polling to ensure that alerts are appearing in Workbench promptly.
Fixed
- The loading icon in some places was a bit too subtle and easy to miss. We’ve standardized on the green dots animation and are continuing to try and improve load times. ● ● ● Thanks for your patience!
- We fixed how we label source and destination IPs in table views so it’s consistent.
- The internal scroll bar in the alerts grid has been removed since you can scroll with your browser.
- We fixed a problem on the Alerts Grid where the count of alerts sometimes didn’t match the number of alerts shown.
- Wait, what day is it? We fixed the custom time range widget to capture the start or end time correctly. We also fixed a form field validation problem that prevented a new investigative action from being saved.
- Fixed a labeling error in the Add investigation form.
- Some alerts with the status of Investigating didn’t display the associated investigation; we fixed this.
- In some situations, multi-selecting alerts to investigate in the Alerts Grid would result in an error. This is also fixed.
- Previously, if there was a long comment in the Critical reason field on a critical security incident, the UI would try to display the whole text in the incident tile. Now, long comments are truncated, so it’s best to keep them short and sweet.
- When you close alerts in bulk or add multiple alerts to an investigation from the Alerts page, the confirmation message will now specify the number of alerts you acted on, instead of being lazy and saying “multiple alerts.”
- We fixed a display issue that caused the action menu for security devices to be partially hidden if the table only contained one security device. No more hide and seek.
- Fixed an issue that prevented changes to a network security device configuration from being saved.
- Fixed some issues that prevented a Splunk device from onboarding successfully.
- Fixed an issue that prevented alert evidence from being displayed.
- We removed the non-functioning checkboxes from the Alert details > Event timeline tab and made this list easier to scan.
- Last but not least, we fixed a display issue that popped up when a closed alert was added to an investigation.