
If you’ve read the Azure Guidebook: Building a detection and response strategy, you learned that we’ve built our own detections and response procedures here at Expel.
Missed the guidebook? Download it here
But what we didn’t share in that guidebook is how we figured a lot of those things out.
Anytime you learned some lessons the hard way, it makes for a long story; which is exactly what I’m sharing with you here.
This story begins with our need to replace a third-party tool we were using to pull logs from various cloud providers. Building it ourselves gave Expel new access to data, improved monitoring and ended up allowing us to update our entire detection strategy for Azure Security Center (ASC) alerts and Azure in general.
Over the years that third-party application started to creak and groan under the pressure of our needs. Something needed to change.

That’s where I came in. (Hi! I’m Matt and I’m a senior software engineer on Expel’s Device Integrations [DI] team.)
Building an integration isn’t a simple or linear process. It’s why we warned Azure guidebook readers to go into the process with eyes wide open. It’s also why we harp on the importance of team communication.
I’ll walk you through how we built an integration on top of Azure signal to help our analysts do their jobs effectively and share some lessons learned along the way.
Finding the right signal
At Expel, building an integration is a collaborative effort. The DI team works with the Detection and Response (D&R) team and the SOC to identify sources of signal and additional data to include in our alerts.
Early on in the process the DI and D&R teams evaluate the technology and to decide which security signals and raw events are accessible. For Azure, all security signals revolve around ASC.
Once we decided on using ASC as our primary alert source, I got to work building out the data pipeline. D&R got to work generating sample alerts within our test environment. Before long we had a POC working that was generating ASC alerts within the Expel Workbench™.
If you don’t already know, ASC provides unified security management across all Azure resources as well as a single pane of glass for reviewing security posture and real-time alerts. It’s one of the primary sources of alerts across Microsoft’s security solutions.
But I still had to figure out the best way to access the data. The good part for Expel was that there are a lot of ways to access ASC alerts; the challenging part is that, well, there are a lot of ways to access ASC alerts.
In the end, we went through three different approaches for accessing these alerts – each with their pros and cons:
When we began development of our Azure integration, the Security API was a relatively new offering within Microsoft Graph. It’s intended to operate as an intermediary service between all Microsoft Security Providers and provides a common schema.
Microsoft Graph Security API presents two advantages for Expel:
- The single point of contact for all Microsoft Security alerts allows us to easily adapt and expand our monitoring services as our customers’ needs and tech stack change without requiring our customers to enable us with new permissions or API keys.
- The common alert schema of the Security API means we only have to adapt one schema to Expel’s alert schema rather than one schema per Microsoft product offering.
We already used Microsoft Graph Security API for our Azure Sentinel integration so we were poised to take advantage of the extensibility of the API by simply adding ASC to the types of alerts we were retrieving, or so we thought.
Our SOC analysts walked us through comparisons between ASC alerts in the Expel Workbench™ and those same alerts within the ASC console. It quickly became apparent that the data we retrieved from Graph Security API were missing key fields.
We had previously used Azure Log Analytics (ALA) to enrich alerts for our Azure Sentinel integration and thought we might be able to do the same for ASC. I worked with the analysts to find different sources of data so we could fill in those data gaps from the Graph Security API.
With this approach, we could find almost all of the alert details not provided by the Graph Security API. The downside and eventual death knell to this approach was that ASC alerts by default are not forwarded to ALA. Forwarding ASC alerts would require extra configuration steps for our customers as well as the potential for increased ALA costs.
The following chart gives a comparison of what ASC fields were found via each API for a single ASC alert for anomalous data exfiltration. Note that each ASC alert type will have different fields but this chart follows closely with our general experience of data availability across these APIs.
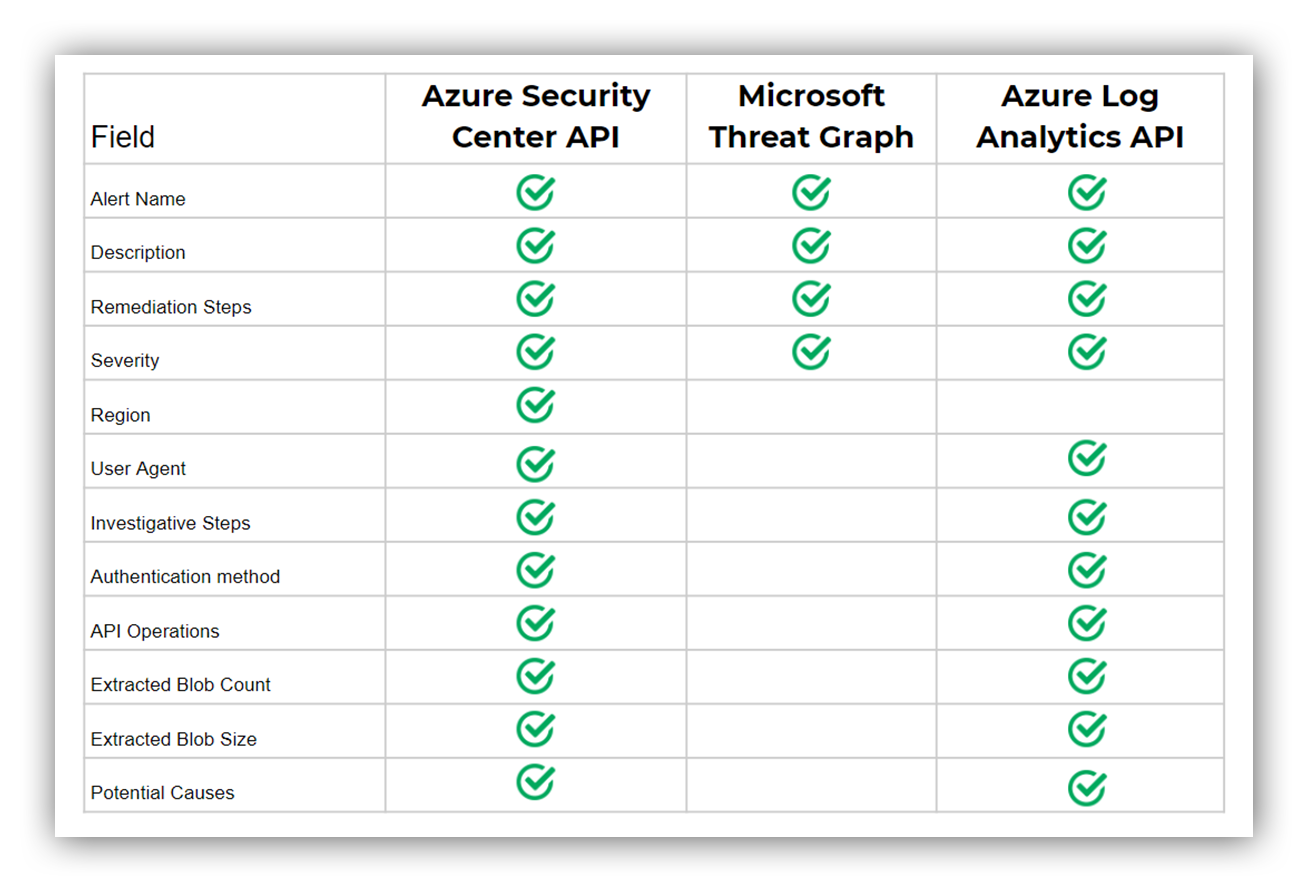
A table showing, for anomalous activity related to storage blobs, what fields in the alert are or aren’t present based on how you access the alert
As the saying goes: when one Azure door closes another always opens.
We couldn’t get the fields we needed from the Graph Security API and we couldn’t reliably find those fields within Azure Log Analytics, but we still had Azure Management API to welcome us with open arms.
The ASC console uses Azure Management API so we knew we could get data parity using that API. The reason we avoided it initially was that the normalization would require a lot more effort.
Each alert type had its own custom fields (see properties.ExtendedProperties field) and there wasn’t a set schema for these fields. Fortunately, we had enough examples of these alerts and could use those examples to drive our normalization of Azure alerts.
In the end, data parity and SOC efficiency are a higher priority for us than some upfront normalization pain, so we went down the Azure Management API route (pun intended).
Scaling our SOC
If you’ve ever worked with ASC, you probably also know that managing the alerts can feel a little overwhelming.
Most of the alerts are based around detecting anomalous behavior or events (like unusual logins or unusual amounts of data extracted). Note that these alerts are generated from different Azure subsystems or resources, so as your environment changes, so do the types of alerts you’ll see.
Microsoft is also constantly improving and updating these alerts so you might also find yourself handling “preview” alerts.
And how do I know all this?
I didn’t until we started to scale up our POC integration.
As soon as our analysts started seeing ASC alerts coming in Expel Workbench™, we immediately got feedback around the lack of context available in the alert.
- Who is the “someone” that extracted data from the storage account?
- What are their usual interactions with that storage account?
- What other user activity was there outside of Azure Storage?
These are all questions that our analysts would need to answer in order to act. The example below shows what little context we had around the ASC alert.
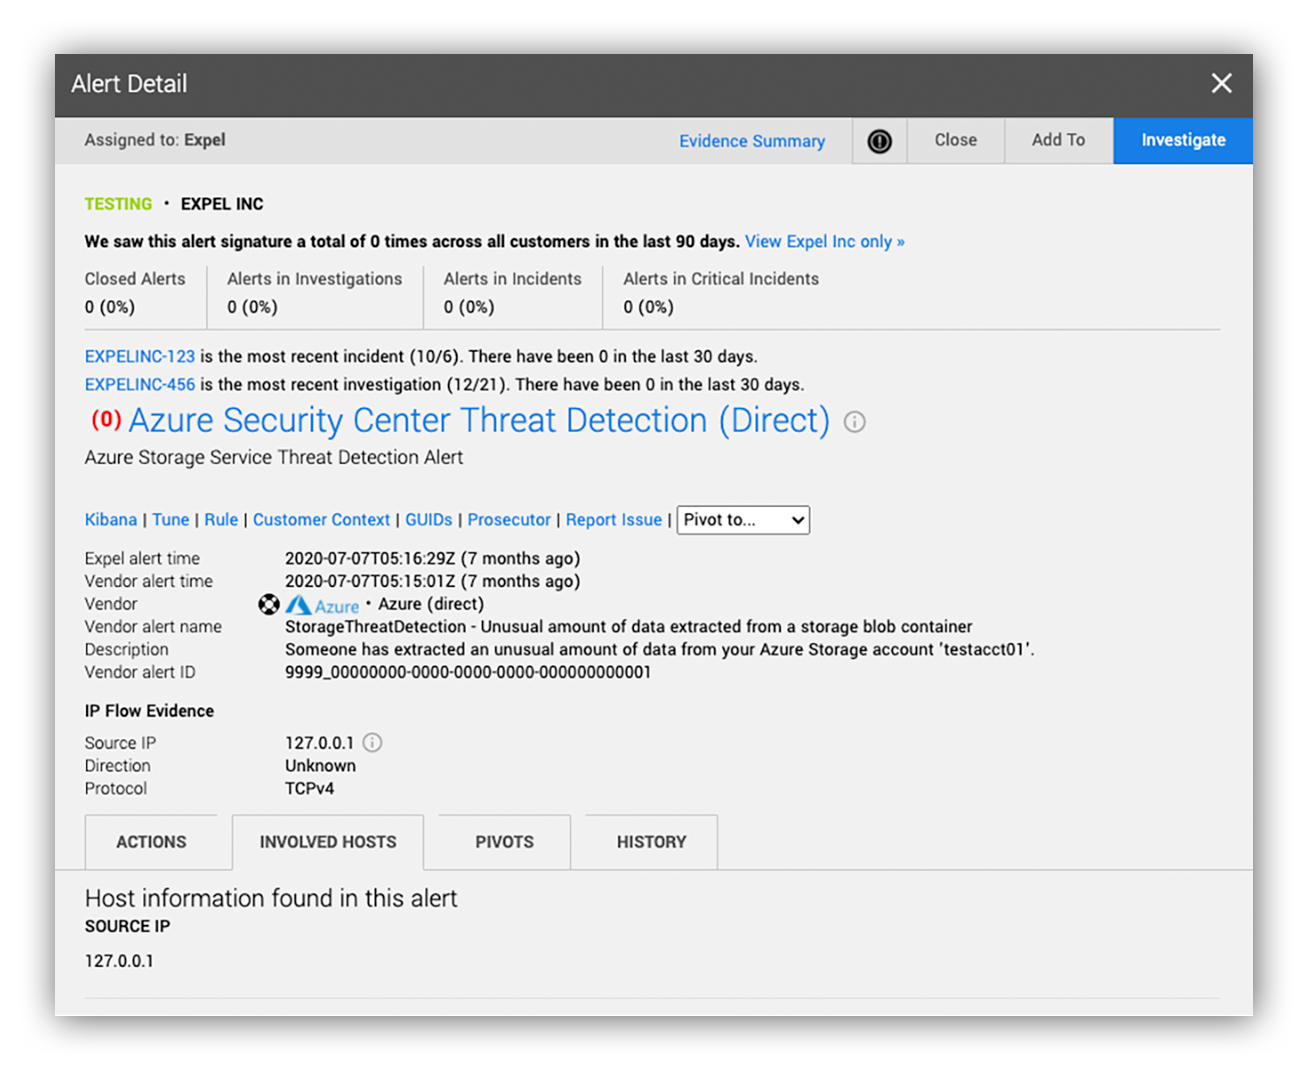
Preview alert with missing storage operation data (ex. Extracted Blob Size)
Without context, our analysts will pivot to the source technology to look for additional fields to help them make a decision. In this case, they log in to the Azure portal to get more info about the alert.
This experience isn’t ideal for our analysts.
As a side note, pivots to console (when an analyst leaves Expel Workbench™ to get more details on an alert) is a monthly metric we present to the whole executive team. We track how many times a day, week and month analysts are pivoting (per each vendor technology we support) because it’s an easy indicator that there’s room for improvement. My team works hard to provide our analysts with the information they need to quickly make good decisions and take action, rather than spending their time doing mundane tasks like logging into another portal.
Any DI team member will tell you that their worst fear is writing an integration that creates extra work for (read as: annoys) the SOC. But most importantly, an efficient SOC helps us support more customers – and provide better service.
For Azure in particular this meant adjusting the noise inherent in having large amounts of alert types and also adding more context around the anomaly-based alerts.
Reducing the noise
We continuously work to improve the signal of alerts with all of our integrations.
ASC, however, was difficult because of the outsized impact configurations have on the variety of alerts you get. For instance, ASC alerts are not generated unless a paid service called Azure Defender is enabled.
Azure Defender can be enabled per Azure subscription, per resource type such as Azure Defender for Servers and, in some cases, per individual resources. The configuration of Azure Defender along with the different underlying resources being monitored created a lot of variance in the alerts.
As we transitioned from our test Azure environment to real cloud environments, we quickly found this out.
Our D&R team generated plenty of ASC alerts but in a live environment we received “preview” (i.e. beta) alerts, duplicate alerts from Azure AD Identity Protection or Microsoft Cloud App Security along with alerts from Azure resources that we couldn’t set up in our environment.
I was able to deduplicate the ASC alerts from other Azure Security Providers (one of the pros of the Security Graph API is that it will do this for you). The D&R team was able to update detections so that we can ignore known low-fidelity alert types and preview alerts. But, even with all of these improvements, we can still get new alert types.
As with any tuning effort, the work is ongoing. But we at least solved the known issues.
Adding moar context
By far the biggest challenge with our ASC integration was getting enough context around an alert so that our analyst could quickly understand the cause of the alert and make triage decisions.
After iterating over all three REST APIs to address the data gaps, we eventually got to data parity between Expel Workbench™ and ASC’s console. However, our analysts still didn’t have the context they needed to understand ASC alerts based around anomaly detection.
Enter the D&R team.
They took the lead on deciphering not only the breadth of alerts ASC generated but also, with the help of our SOC analysts, determined what types of log data were needed to understand each of these alerts.
For instance, when we got an ASC alert warning of “an unusual amount of data was extracted from a storage account,” D&R built automation in the Expel Workbench™ that uses platform log data to show analysts exactly what the user’s “usual” actions were.
Helpful; right?
You can see an example below.
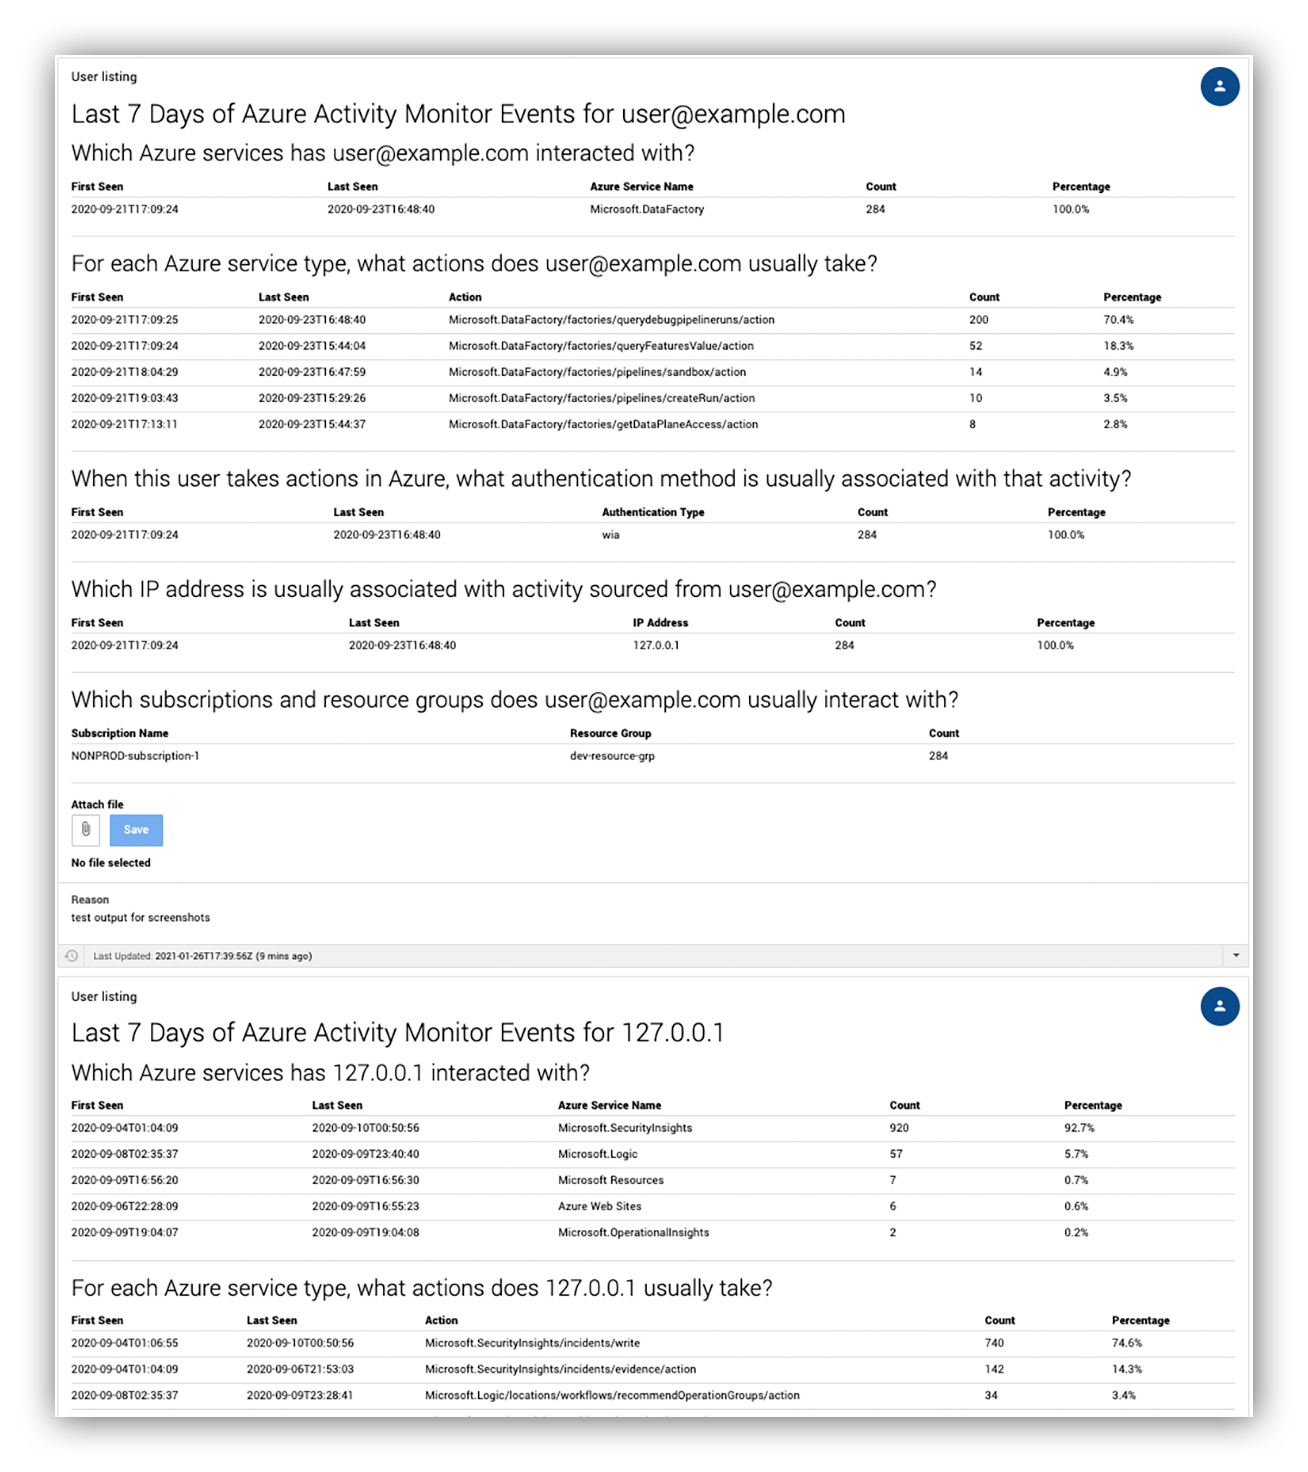
Example of automated decision support for an ASC alert in Expel Workbench™
That not only bridged the context gap of the ASC alerts but also helped provide a framework around how our analysts triage ASC alerts. And as a bonus it didn’t require them to perform any additional manual steps or pivot into the Azure portal.
Is this thing on?
Finding the right alert signal and making sure our SOC can triage that signal efficiently are the bread and butter of any integration. However, getting those right doesn’t necessarily mean we’ve created a great integration.
Alongside these priorities, we’re focused on operations aspects of the integration: creating a good onboarding experience, ensuring we have optimal visibility (health monitoring) and reducing storage costs.
Improving visibility
When building the Azure integration, we added plenty of metrics to help us profile each environment.
Some technologies we integrate with have a fairly narrow range of configuration options but when it comes to monitoring an entire cloud environment that range becomes very large, very fast.
As we onboarded customers, we were not only looking at performance metrics but also monitoring subscription totals, resource totals and configurations of each resource.
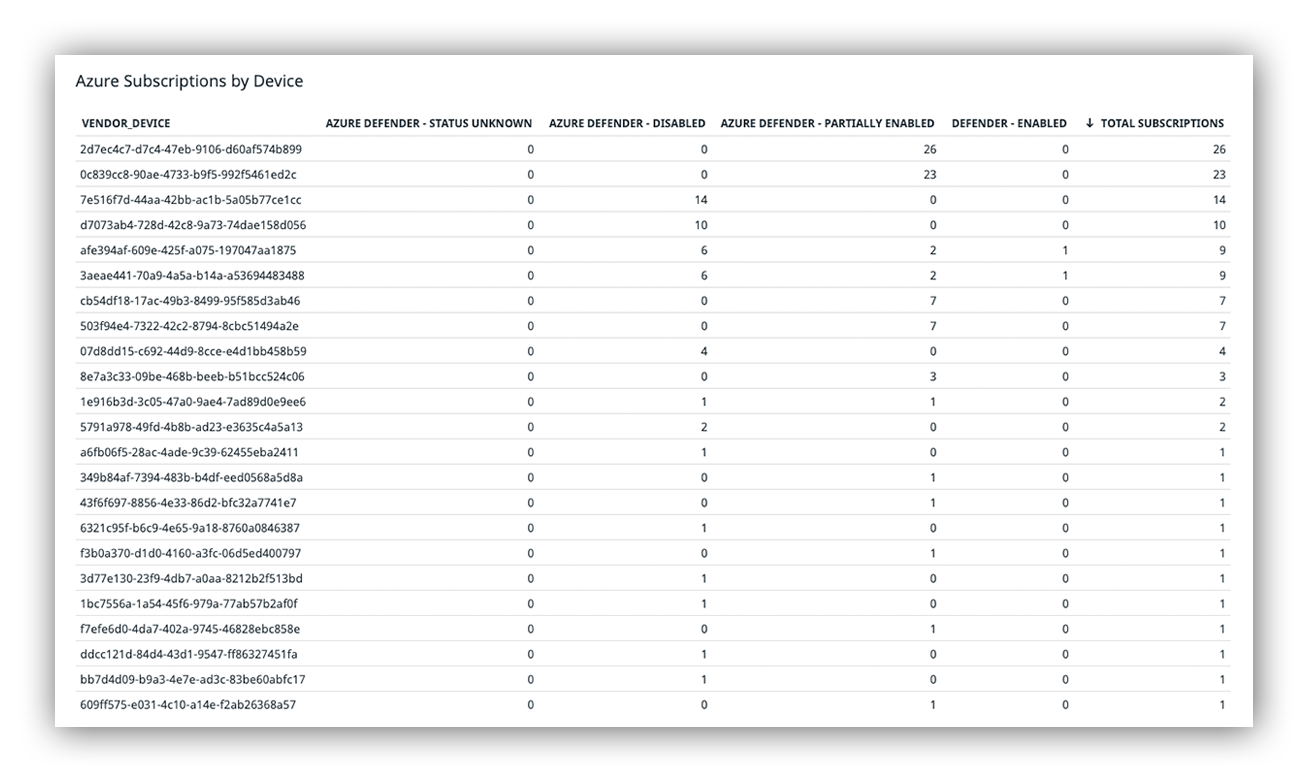
Example customer Azure Subscription totals with Azure Defender configuration settings
The image above shows a sampling of a few of our Azure customers, the number of subscriptions we’re actively monitoring and the various Azure Defender configuration settings we detected. You can see there’s a broad number of total subscriptions, and Azure Defender is in various status across the customer and subscriptions.
We knew these metrics would help us provide insight to customers on how to maximize our visibility; we just didn’t realize how quickly that was going to occur.
Right away we started catching misconfigurations – disabled logs, Azure Defender not being enabled for any resources, missing subscriptions, etc. We could do as much alert tuning or detection writing as we wanted but without the proper visibility it wouldn’t be much use.
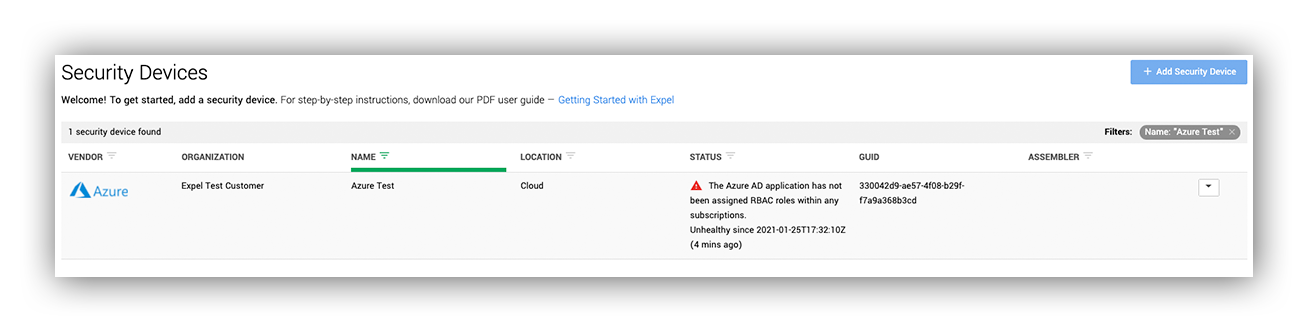
Example Expel Workbench™ warning of a potential device misconfiguration
You might be noticing a theme: the importance of feedback.
And our feedback loop doesn’t just include our internal teams. Ensuring our customers are on the same page and can share their thoughts is critical to making sure we’re doing our job well.
So, as we onboarded customers to the integration, our Customer Success team jumped in to work with customers to find ways to improve their configuration. They then ensured each of these customers understood the way our Azure monitoring works and the value of these configuration changes.
As the Customer Success team worked, the Turn on and Monitoring team (this is Expel’s internal name for our feature team focused on making onboarding simple, intuitive and scalable along with proactively detecting problems with the fleet of onboarded devices Expel integrates with) used this feedback to build out a way for us to provide automatic notifications for common configuration issues.
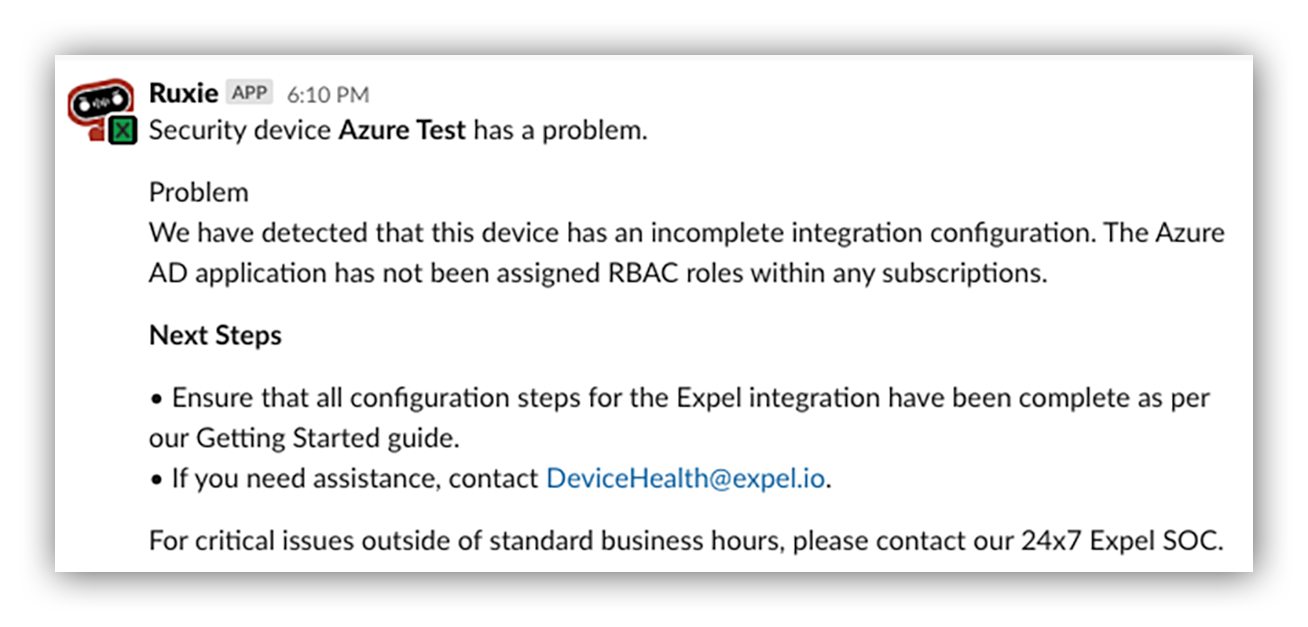
Example Ruxie notification for a misconfigured Azure Expel Workbench™ device
Did you forget to provide access for us to monitor that subscription? No problem. We automatically detect that and provide you a notification along with steps to fix the issue within minutes of creating the Azure device in Workbench™.
Keeping costs in check
There are design decisions which have very real implications toward cost as you build out integrations with an IaaS provider.
Azure was no different.
Requiring customers to enable Azure Defender increases their Azure bill. Requiring customers to forward resource logs to Azure Log Analytics increases their Azure bill. If we only integrate with Azure Sentinel, that increases our customer’s Azure bill. And so on…
When it comes to these decisions, we lean towards reducing direct cost to customers.
We’ve already discussed how important log data is for providing context around ASC alerts. Azure Storage log data is particularly important. This log data is basically a bunch of csv files within Azure Storage itself.
If you want to search this data, you have to forward it to a log management solution within the Azure ecosystem – that means Log Analytics. During the development of the integration, the best resource from Microsoft for forwarding logs was to use a PowerShell Script to pull storage log data, translate it into JSON format and upload it to a Log Analytics workspace where the data can then be searched or visualized.
As of this writing, there is a preview Diagnostic Settings feature for Azure Storage accounts that allows automatic forwarding of logs to ALA via the Azure console.
Even though forwarding the logs to ALA is becoming easier, storing these logs in ALA can be expensive. In some cases, our customers would have paid more than $300 a day, or over $100k a year, to store their Azure Storage logs within ALA.
Instead of requiring customers to foot the bill for the storage and also adding yet another configuration step, we decided to directly ingest those logs into our own backend log management solution. This helped us solve the cost problem across all our customers with a single solution.
A typical approach to solving this problem is to figure out which logs you don’t need and then filter them out prior to ingestion. In the case of Azure Storage, each log entry is a storage operation so it drops benign operations during ingestion.
This approach is difficult for two reasons.
The first is that we’re dealing with a large variety of Azure environments. Determining a set of benign operations may be possible for a single environment but the odds aren’t good for determining benign operations across all customer environments.
The second is that these logs helped provide context around detections of anomalous behavior. Removing whole swaths of logs would make understanding what was normal versus abnormal more difficult.
To get around this, I worked with D&R to create a log aggregation approach that would decrease the log volume without filtering whole chunks of logs or reducing our context.
The idea was that we could determine what log entries pertained to the “same” operation but at different points in time. If the operations were the “same” then we would combine them into a single log record with added operation counts and time windows. Based on the operation type we could loosen or tighten our definition of “same” in order to provide better aggregation performance.
In the end, we were able to achieve a 93 percent reduction in volume across all of the storage accounts we were monitoring while still maintaining the contextual value of the logs themselves.
This was no small feat considering the diversity of Azure Storage use cases, and thus log content, across our different Azure customers.
Estimated costs for searchable Azure Storage logs
Volume (MB/day) |
Est. ALA Cost ($/yr) |
|||||
| Device | Azure Storage Accounts | Raw | Aggregate | Raw | Aggregate | Reduction (%) |
| cb7ebb31-c17f-4b73-9962-db585b94f58d | 68 | 173268 | 2917 | 138547 | 2332 | 98.32 |
| 6321c95f-b6c9-4e65-9a18-8760a0846387 | 24 | 54551 | 10047 | 43619 | 8033 | 81.58 |
| 0c839cc8-90ae-4733-b9f5-992f5461ed2c | 168 | 19287 | 626 | 15422 | 500 | 96.76 |
| afe394af-609e-425f-a075-197047aa1875 | 5 | 15718 | 5027 | 12569 | 4019 | 68.02 |
| f3b0a370-d1d0-4160-a3fc-06d5ed400797 | 7 | 1569 | 9 | 1254 | 7 | 99.45 |
| 8e7a3c33-09be-468b-beeb-b51bcc524c06 | 58 | 49 | 13 | 39 | 10 | 73.58 |
| 503f94e4-7322-42c2-8794-8cbc51494a2e | 21 | 40 | 17 | 32 | 14 | 56.90 |
| 3d77e130-23f9-4db7-a0aa-8212b2f513bd | 2 | 17 | 2 | 14 | 2 | 88.47 |
| 1bc7556a-1a54-45f6-979a-77ab57b2af0f | 1 | 16 | 2 | 13 | 1 | 88.68 |
Above is the table we built internally to track various customer storage costs as we worked to reduce their cost and still capture relevant logs to enable detection and response.
Teamwork: Always Azure bet
Our goal is to always provide high-quality alerts with as much context and information to both our analysts and customers.
The collective expertise of our teams and their ability to react and solve problems in real-time helped us not only replace the third-party application, but also create an entirely new detection strategy around ASC that improves visibility and coverage for our existing customers, and improves our analysts’ experience – creating greater efficiency across the board.
Remember the feedback loop I mentioned?
Like all integrations we build, we don’t consider the integrations to ever truly be complete. There’s always another company behind integrations that is making changes (hopefully improvements) that affect Expel.
That’s another reason communicating in real-time is key. Each of Expel’s internal teams have the ability to drive changes to the integration or detection strategy.
If you’re considering building your own detections on top of Azure signal, I hope this post gave you a few ideas (and maybe even saved you some time AND money).
Want to find out more about Azure signal and log sourcing? Check out our guidebook here.
: Hey CISOs, stop guessing when it comes to cloud security")
: What attackers don’t want you to know")
: The cloud security mythbuster—what MDR really means for cloud")
: Making a roadmap for cloud security")