
In this final post of our three-part blog series on all things SOC metrics and leadership, we’re going to take the framework we described in the previous posts and share how we applied it in some specific situations.
We’ll point out a few gotchas and lessons learned along the way.
Success story #1: The duplicate alert issue
Metric: How many alerts do we move to an open investigation or incident?
TL;DR: Finding improvements is often the combination of a set of metrics and the analysis to understand what those metrics mean.
As we mentioned in part 1 of the series, one of our strategic goals is to understand our analysts’ capacity and make sure we’re making good use of it. Which means we need to understand what our analysts are doing.
There are a bunch of ways to measure this, but since we were after understanding it as a process, we measured the various paths an alert can take through our system, and how long each alert spent in each state of our alert system.
Understanding which stages an alert needs a human to get involved can give us an idea of where to focus our optimization energy.
So, we added counters and timestamps to measure the path of each alert we processed.
The diagram below shows our state machine, and the number of times alerts travel down each path. The data showed us that the number of alerts that were added to existing investigations accounted for 20-25 percent of all the alerts we handled.
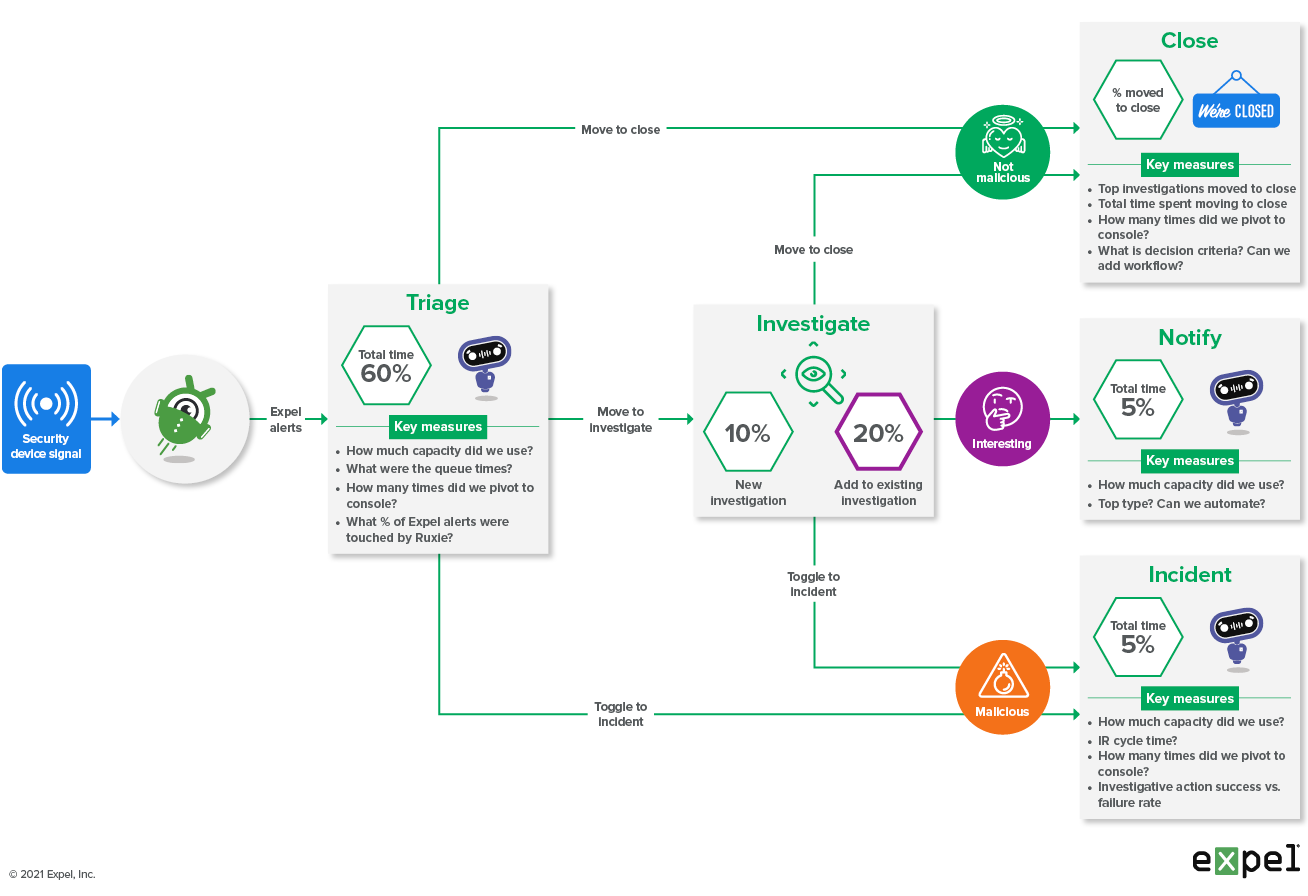
Expel SOC alert system diagram
Now that we have measurements, we have to ask ourselves – what are they telling us?
The data suggested that, while our analysts were investigating something, another alert related to the same behavior would come in.
We’ve all been there – you go heads down and ignore the queue for a few minutes only to pop up again and realize there are 10 more beacons or the network tech is now reporting what the endpoint saw.
So the metrics were explainable, and it turned out this was having an impact – it happened a lot, which was adding up to wasted time.
From here, we formulated our reaction. In this case our analysts and our UX team worked together to add a feature to our platform to automatically route related alerts to the appropriate investigation. As part of this process we added configuration to allow the analysts to widen or narrow the alert routing filter, based on what they thought “related” alerts might be.
We deployed these changes into production and watched what the impact was on the SOC. The graph below shows the change interval:
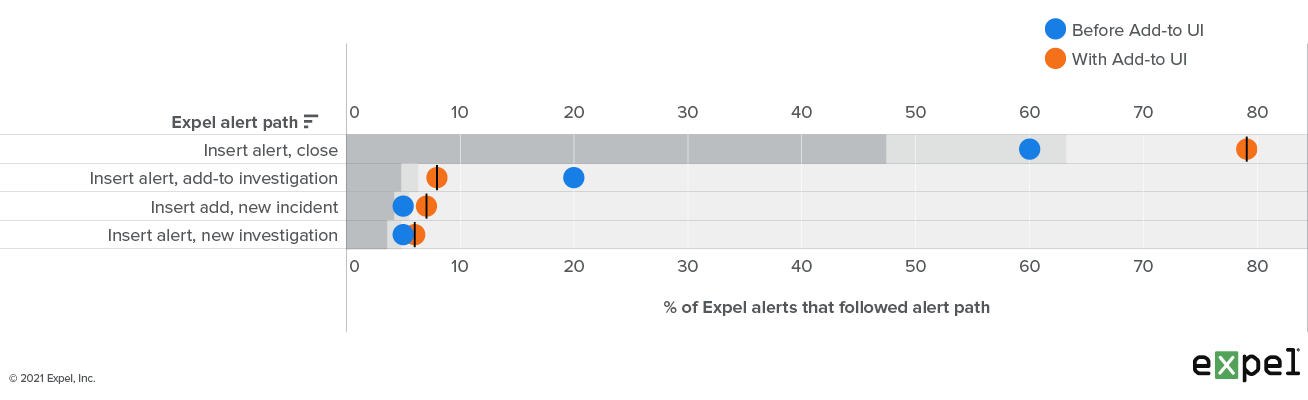
Expel alert pathways before and after adding new UX tot auto add an alert to an investigation
What we see is that we’ve managed to cut the number of add-tos by 12 percent. Considering that typical triage time is four minutes, this translates to 12 percent x number of Expel alerts x four minute savings per week for our analysts.
Success story #2: So much BEC
Metric: How many business email compromise (BEC) incidents do we handle each week and what’s the cycle time?
TL;DR: You can simultaneously improve two metrics that are in tension with each other – like speed and quality – but you have to be creative to do it.
In addition to understanding capacity, another goal is to respond faster than delivery pizza arrives at your door (30 minutes or less). One way we can do that is to stand on the SOC floor and shout: “Move Faster!!!”
We’ve all worked there, and it wasn’t good for morale or for quality. We elected to follow a different path. By understanding what type of work was taking the longest and happening the most, we figured we might be able to get crafty and improve performance while keeping quality high.
As a general rule, we look at (a) the things we do a lot and (b) the things that take a long time.
To figure out where to target our efforts, we used gross counts of incident types – the theory being that incidents take longer to investigate and report.
In this story, our SOC observed that, week-over-week, business email compromise was one of our most common incident types, making up about 60 percent of the incidents we handle. This looked like a prime place to optimize.
From here, we asked the question: What about this process is taking the longest?
To find the answer, we used a set of path metrics – each step in each alert is timestamped. By aggregating these timestamps, we learned that reporting was the most time consuming portion of the incident handling, taking over 30 percent of the total incident time.
| Step in process | Typical cycle time (excludes wait time) |
|---|---|
| Triage alert(s) for BEC attempt | 3-4 minutes |
| Move to investigation | Seconds |
| Preliminary scoping | 5-8 minutes |
| Declare incident | Seconds |
| Add remediation steps | 1-2 minutes |
| Secondary scoping | 15-20 minutes |
| Complete summary of “Findings” | 20-25 minutes |
Typical BEC cycle time pre automation
This is where things get challenging – blindly optimizing the reporting could lead to a massive drop in quality. The report, after all, is the thing that tells the org what to do in response. A bad job here and we might as well hang it up.
Once again, the combination of Expel’s UX team and the SOC proved to be magical – they designed an enhanced report including graphics and charts that was both more useful to the customer, as well as more automatable.
The speed and quality of our reporting went up! In the table below you can see we improved our BEC incident cycle times by about 34 percent AND the quality of our reporting.
| Step in process | Typical cycle time (excludes wait time) | |
| Pre-report automation | With report automation | |
| Triage alert(s) for BEC attempt | 3-4 minutes | No change |
| Move to investigation | Seconds | No change |
| Preliminary scoping | 5-8 minutes | No change |
| Declare incident | Seconds | No change |
| Add remediation steps | 1-2 minutes | No change |
| Secondary scoping | 15-20 minutes | No change |
| Complete summary of “Findings” | 20-25 minutes | 5 minutes (-34%) |
BEC cycle time by step pre and post reporting automation
Success story #3: Handing off work to the bots
Metric: What classes of work do we see week-over-week? Are the steps well defined? Can we automate the work entirely to free up cognitive loading?
TL;DR: Metrics can help you target automation to yield defined benefits in short time periods, rather than trying to generically automate “analysis,” which is a bit like solving the halting problem.
We’re constantly looking for ways to remove cumbersome work from humans – allowing them to focus on the more creative aspects of the job.
But first we need to understand what classes of work we’re doing and then figure out what can be automated.
To answer these questions, we collect two sets of metrics:
- Counts of the number of each type of alert we receive
- Count of each type of action we perform in response to those alerts
For example, we get 27 malware alerts per week, and our investigative process involves acquiring a file and detonating it 85 percent of the time.
To be clear – gathering this data was a process rather than a discrete event. We continuously collected metrics to understand the types of actions we were performing along with the classes of alerts we were responding to.
Turns out both of these metrics followed a Pareto distribution – we saw that 85 percent or more of the work was being spent on one or two top talkers: 1) suspicious logins and 2) suspicious file and process activity.
To automate investigations into suspicious logins ,we started by understanding how often suspicious login alerts were moved to an investigation.
Turns out, a lot.
Then we studied which investigative steps our analysts were taking and then handed off the repetitive tasks to the robots. The full details can be found here, but the net result is that we improved the median investigation cycle time into suspicious logins by 75 percent!
We then repeated this process by automating our investigation into suspicious file and process events, which was also Pareto distributed. At a certain point, we got down to things that we’re not doing often enough to worry about. That’s when we realized the development and maintenance cost exceeded the time and frustration savings.
This is an ongoing effort. So far, it helps our analysts in 95 percent of our alert triage in any given week.
That’s a wrap!
We hope you’ve enjoyed reading this three-part SOC metrics blog series.
Before you go off and create metrics for your SOC’s performance, remember:
- Have a goal in mind before measuring all the things. A clear outcome will inform what to optimize.
- Leadership is the key to SOC efficiency – use metrics data to find ways to take care of your team and avoid burnout.
- Developing metrics doesn’t mean just plugging in numbers for reports. Applying your measurement framework will be unique for each situation – it’ll require a curious mind, a keen eye and a willingness to always find new ways to improve the process.
There’s no more strategic thing than defining where you want to get to and measuring it. Strategy informs what “good” means and measurements tell you if you’re there or not.
Lastly, performing quality control (QC) is vital to your continued success.
Check out our Expel SOC QC spreadsheet to see what our analysts look for when assessing performance. As an added bonus, you can get your own copy of this resource. So go ahead and download it (free of charge!) and customize it to fit your org’s needs.
Stay tuned – we’ll be talking more about measuring SOC quality in a blog post coming soon!


