
In September 1952, “I Love Lucy’s” Lucy and Ethel decided to go to work in a candy factory. They were placed on an assembly line and told to individually wrap chocolates as they passed by. “If any of these end up in the packing room unwrapped, you’ll both be fired,” the supervisor said.
The situation was fraught, and hijinks ensued. By the time cameras stopped rolling, Lucy and Ethel had fallen behind. Unwrapped candy was flowing into the packing room and both women had resorted to eating chocolates to try to stanch the flow.
Back in the 1950s, this account of an overloaded system was “comedy gold.” But you’re probably wondering what any of this has to do with information security. Well, we see this type of thing pretty regularly in the security world. It’s usually called “alert fatigue” and it’s not nearly as funny. Whether it’s chocolate or alerts, fundamentally we’re talking about the same problem: we’re underwater, we’ve started resorting to a ton of things we know aren’t the right solution just to keep up and yet we’re still underwater.
When confronted with this situation, CISOs (or chocolate-factory owners) need to make some decisions about how to get out of trouble. It’d be a mistake, however, to just start making changes. It’s best to make sure that you understand the system first.
The system
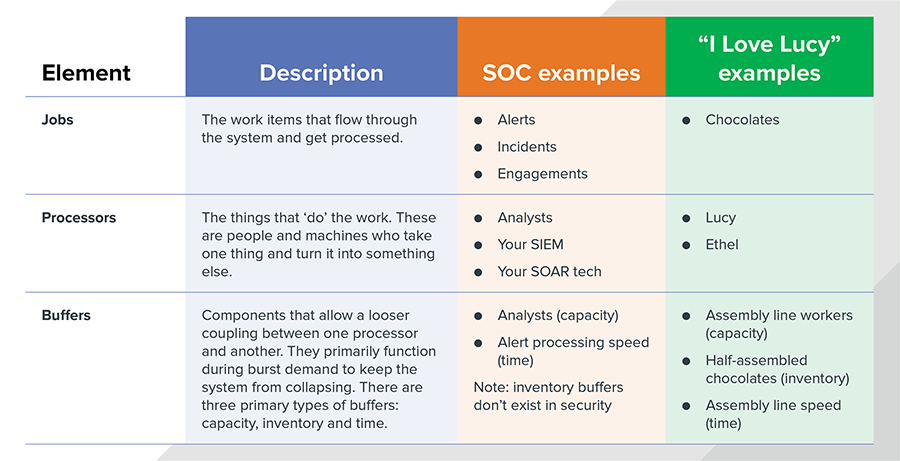
Using broad brush strokes, all systems that process work items (or jobs) can be boiled down to three basic elements: jobs, processors and buffers.
- Jobs are the work items that flow through the system and get processed. Lucy and Ethel had chocolates, the security world has alerts, incidents, engagements and the like.
- Processors are the things that “do” the work. These are people and machines who take one thing and turn it into something else. This definition includes everything from Lucy and Ethel, who process chocolates by wrapping them, to your SIEM that takes a bunch of log data and correlates it together as a single security alert.
- Buffers are components that allow a looser coupling between one processor and another. They primarily function during burst demand to keep the system from collapsing. There are three primary types of buffers:
- Capacity: You can add more people/processors to your production system. This is what happens when your grocery store adds more checkout people during a rush.
- Inventory: You can store up work to do later when a processor is idle. Anytime you see a warehouse or a table of parts in a workshop, you’re looking at a buffer. Security teams, sadly, do not benefit from these – inventory does not exist in the security world.
- Time: You can take longer to produce something. Ever been to the DMV? If so, you’ve experienced a time-based buffer.
The three elements of systems
Okay, I’m going to warn you that this is where things get a little nerdy (and a little math-y). If you thought it was nerdy before, then well … brace! But rest assured the math will lead us to a place of better understanding.
Here goes. Every production system involves some configuration of the three elements above, organized to optimize for some outcome. For example, if chocolate arrives on the conveyor belt at an average rate λ, and Lucy and Ethel can each wrap  chocolates on average, we can show the chocolate factory schematically like this:
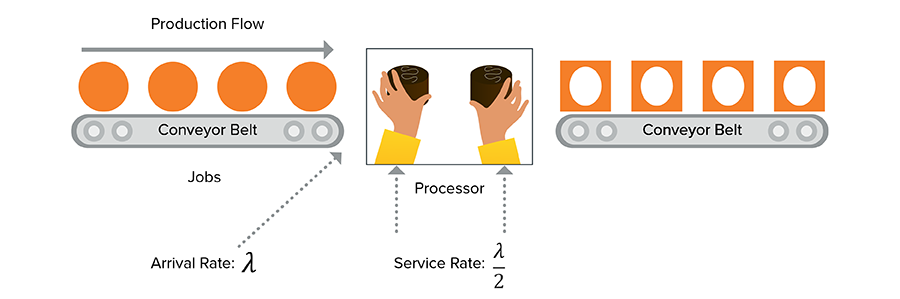
If chocolate arrives on the conveyor belt at an average rate that equals the average processing rate, then everything will be ducky, right? Wrong! And this is where things begin to go off the rails for our heroines, and many times, for hapless security operations teams.
Variation: the source of security operations potholes
If you watch the video closely you may notice that Lucy and Ethel were doing OK for the first little bit. Then Lucy misses a step and starts to stumble. From this point on, they’re doomed1.
The issue here is variation. If a job takes too long, then the next one gets started late, and the next one, and so on – the system will never catch up. In the real world, processors aren’t perfect: a chocolate is hard to pick up, alerts turn into investigations, attackers get creative – variation is in everything. And when quality begins to slip, this problem can compound – unwrapped chocolates may be returned for re-work, increasing the input rate and causing the problem to get worse.
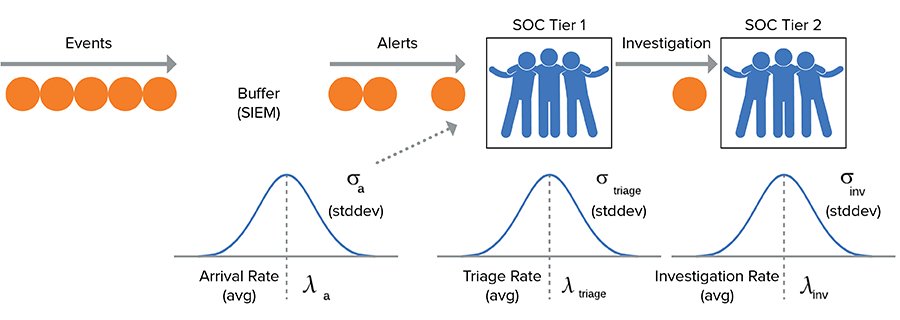
With this in mind, we’re better off viewing the chocolate factory more like this:
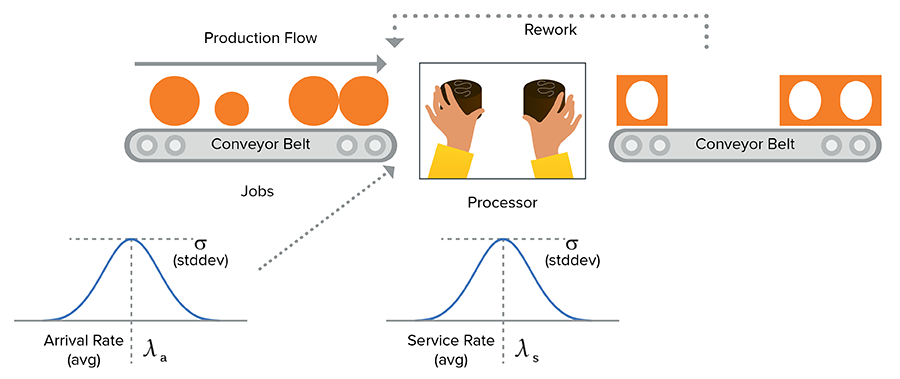
Chocolate is still arriving at an average rate of λ, and being serviced at an average rate of , but now there’s variation in these rates (as indicated by standard deviation or 𝜎).This variation is the root of many a smoking crater in the security operation center (SOC).
Waltz or hip hop in the SOC? The intricate dance between variation and utilization.
In the event of a big burst of inbound work like Valentine’s Day at the flower shop (or a new signature set from an IDS vendor), most production managers will ask the team to “dig deep” and work a little harder to clear the backlog. In more formal terms, the manager is increasing utilization, which may increase throughput. What’s not entirely obvious, though, is that this also makes the system more fragile. Why? You guessed it … variation.
In SOC operations, alert processing time is often a big concern. Attackers are on the move and people want to know “how long will it take us to go from a signal to a reaction?” To see how the relationship between variance and utilization impacts alert processing time, it’s helpful to express the relationship mathematically (in this case with the Kingman approximation2).

In case math isn’t your thing, what this equation says is that the estimated service time is related to the variance in the arrival and service times (V or  ), the utilization of the processor (U or
 ![]() ) and the average service time μs.
) and the average service time μs.
Let’s make a few assumptions to turn this equation into a real example:
- Alerts arrive, on average, every 10 minutes. The standard deviation is three minutes, so

- On average, it takes you two minutes to triage them, with a standard deviation of four minutes (they vary wildly), so
- Your utilization is 70 percent, so


Based on those assumptions, the equation tells us that the average alert wait time will be:

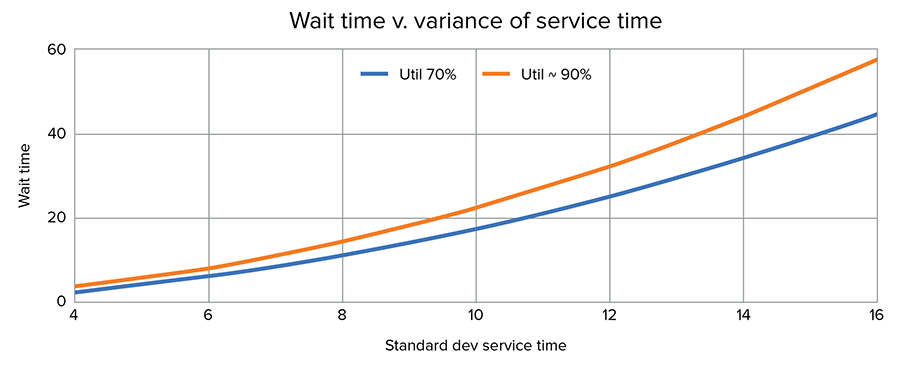
In case deciphering equations isn’t your thing, what this means is that it will take about 9.47 minutes before an alert gets reviewed in this system. This is a little tight, but probably alright since the alerts are only arriving every 10 minutes on average. As the variance in our process increases, the alert wait time will increase. This makes sense since our analysts will be spending more time on some of the alerts, which forces newer alerts to wait longer.
This is compounded by utilization. If we, like Lucy and Ethel, are already at 90 percent capacity and a single variation happens, it can knock us off our game. The chart below shows the effects of increasing variation at two different utilizations: 70 and 90 percent. The wait time in the process with 90 percent utilization increases much faster than when there is a buffer to absorb it.
There are a few interesting things about this relationship, which can help us plan better:
- The average service time is one of three factors that contribute to service time. Making each member of your team faster is not the only thing in play.
- The utilization term tells us that operating a SOC team (aka a processor) at close to full capacity will magnify any variance in the system. If Lucy had time to correct her first mistake, the episode would have been less funny because she would have had some buffer to recover.
- The inclusion of variance as a term is a bit more abstract. In a toll booth you separate out the people with E-ZPass/FasTrak and the people who pay with bills so you don’t stick a bunch of fast people behind someone paying with change they’re still digging out of their seat cushions.
- Perhaps the most important thing this equation tells us is that these quantities are multiplicatively related – small changes in variance in a system that is already at 90 percent utilization will be catastrophic to service time. Similarly, small changes in utilization have the potential to move the needle quite a bit.
That’s enough math. What does it mean for my SOC?
Let’s say you’re a CISO with a team of three that’s buried in 200,000 alerts a day. What should you do? And how does any of this help?
Good question, here’s a rough schematic to use as a strawman:
Given this diagram, let’s look at the knobs we can turn:
- Inventory buffers: While our SIEM is useful to provide a little rate-decoupling, it’s not really an option to store the alerts and work them next week – the attacker won’t wait on us.
- Quality: We can’t reduce the quality of our work to speed it up. We’d miss things and that would be bad™.
We’re not without hope though, there are still some dials we can turn:
Dial #1: Tune your devices (arrival rate)
It goes without saying that if the average arrival rate exceeds the average service time, you’re hosed. As we learned above, if the average arrival rate equals the average service time, then the system is iffy at best.
Tuning your devices is the number one way to adjust arrival rate. SIEM and IDS technologies are legendary for the ‘firehose of alerts’ problem. Investing time in filtering and tuning these, or investing in technology with a higher signal-to-noise ratio is probably the number one thing you can do. Guard against purchasing additional gear without tuning existing devices — new signal compounds the problem.
Dial #2: Increase alert triage efficiency (service rate)
The time it takes to process an alert is:

Measuring these times, or at least having a rough idea of how long they take is instructive:
- If 99 percent of all alerts are closed out during triage, then investment there will have the biggest bang. Automating alert enrichment and providing context will speed up triage, while training your SOC analysts can boost capacity so each analyst can handle more alerts.
- To decrease the time to investigate, endpoint detection and response (EDR) or network forensic tools are your first stop. Many shops skimp here, and that may be a mistake. If one investigation takes eight hours because it has to be done manually it can easily swamp a small team. An EDR tool could reduce investigative time to an hour or less.
Dial #3: Hire more analysts (capacity)
If, after optimizing the time it takes to triage a single alert, your service rate is still lower than your arrival rate, you’ve got to add capacity. That means hiring analysts. This can be an expensive proposition, though there are alternatives.
Dial #4: Variance (aka the unexpected)
As the Kingman equation shows us, the variance that’s so pervasive in security operations can uncork an otherwise well-regulated system. There are two components to this:
- Arrival rate – if your team comes in every morning to a flurry of new work, consider staffing a night shift. This can keep the work from building up and smooth out the workflow. Outside of that, there’s really not much you can do to adjust this variance.
- Service Rate – there are two things that can help here: automation and training. Experience tells us that training should almost always be our first stop – in the world of cheap python scripts and API-driven applications, human variance is by far the more pernicious of the two.
Conclusion
Alert fatigue in a SOC is a real problem and one that just about every organization has to deal with. It’s such a problem that – for better or worse – there’s an entire SOC role whose sole job is to help cope with it.
The problem that many organizations encounter when they try to address alert fatigue is that they don’t take the time to understand the system that they’re trying to change. Instead, they just start making changes. Lots of times those changes include tweaks to their processes intended to achieve admirable-sounding outcomes like “reduce the time it takes to investigate a security incident.” But if you don’t take the time to understand the system, you can get some undesirable outcomes. For example, you might reduce the time it takes to investigate a security incident only to find that you’ve unwittingly changed your system in such a way that you’re now missing actual security incidents. If you’re a fire chief, it doesn’t make a lot of sense to put Ferrari engines in fire trucks so you can get to the fires faster.
So, before you implement your SOC metrics program, before you start tweaking your SOC processes and before you start making staffing adjustments, take the time to understand the system that you’re operating so you know how changes to that system will impact its operation. After all, there’s only so much chocolate that two people can stomach if the system goes off the rails.
___________
1 It does not help that the assembly line actually sped up during the scene, but the result would have been the same at a constant rate.
2 For the sake of simplicity, we’re modeling the single processor case. In normal SOC operations, you’d use the G/G/c form of this.
")

")
