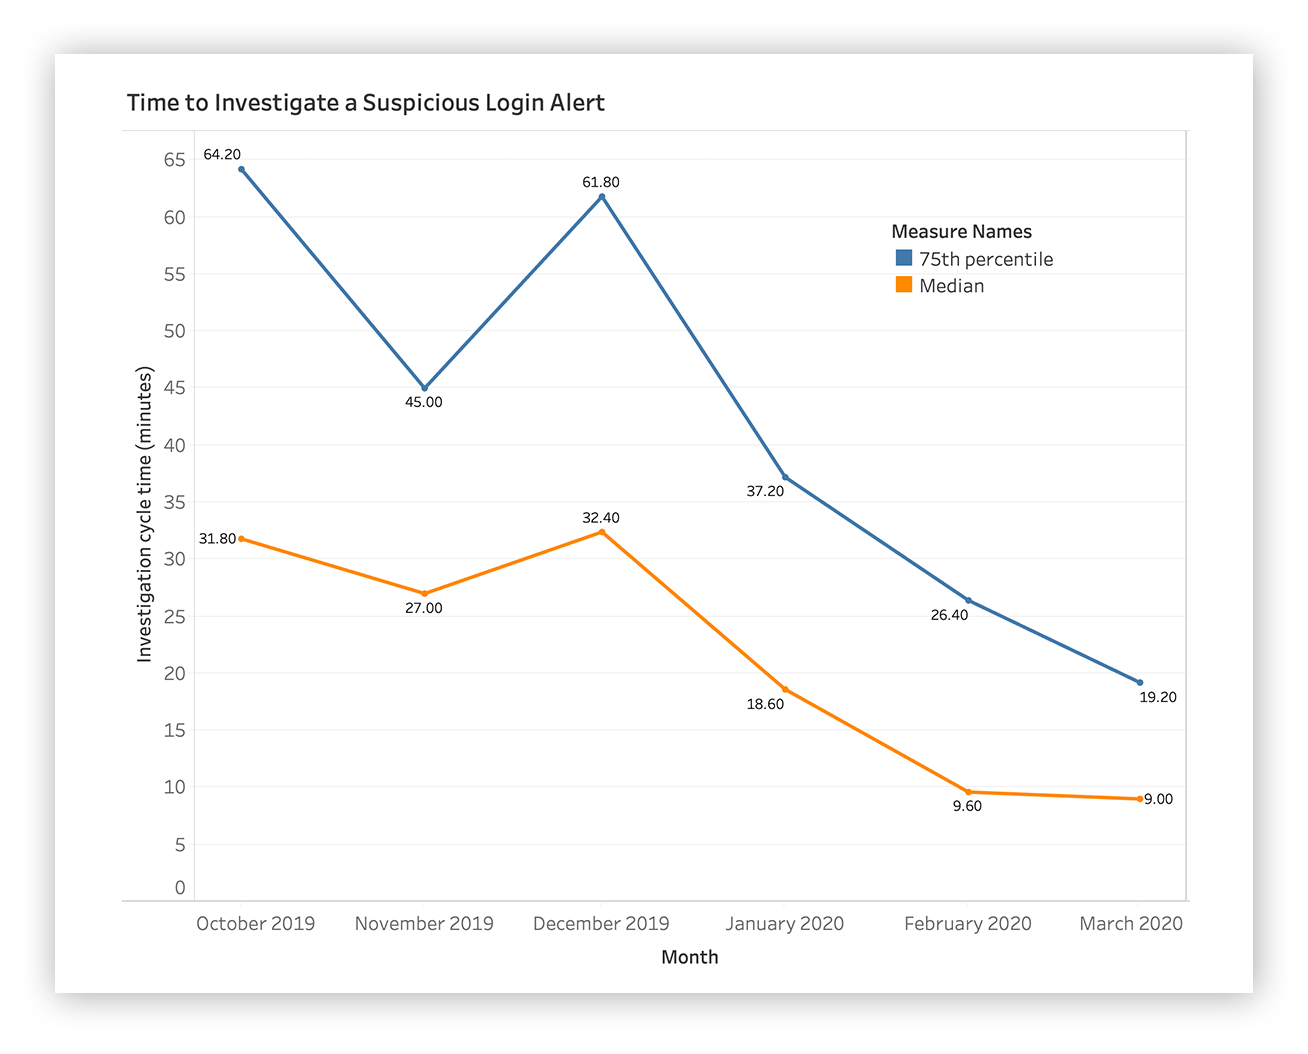
Spoiler alert: We improved the median time it takes to investigate and report suspicious login activity by 75 percent between October 2019 and March 2020. We did it by reviewing the investigative patterns of our SOC analysts and deploying a ton of automation to enable our team to answer the right questions quickly.
You’ll see in the chart below that we’ve managed to reduce the time it takes to investigate a suspicious login to a matter of minutes over that six-month period. We’re showing the median and 75th percentile here.
TL;DR: Line goes up, more time spent. Line goes down? Efficiency FTW!
Time to investigate a suspicious login alert
Wondering how we turn repetitive tasks into SOC efficiency?
We’ll walk you through our view of SOC operations and the key metrics we use to understand where we’re spending too much analyst time on things we should hand off to our robots.
But first we’ll take you through how we deployed decision support to reduce the challenge of triaging suspicious login alerts (these can be such a pain if not done correctly, amiright?).
What’s decision support?
First things first: Decision support is how we use tech to enable our SOC analysts to answer the right questions about a security event in an easy way.
In doing so, we reduce cognitive loading and hand off the highly repetitive tasks to automation (AKA our robots). It’s also a key component on how we make sure our analysts aren’t over subscribed.
Pro tip: If you ever go on a SOC tour and the first thing you notice is a lot of sticky notes (hopefully not with passwords on them), that’s the opposite of decision support.
At Expel decision support is made up of four key components:
- Automation
- Contextual enrichment (especially important in the era of cloud automation)
- Investigation orchestration
- User interface attributes
How do you build decision support?
The bottom line is this: Start by understanding where the team needs the most help, now.
What we mean by that is figure out the class of alerts that take the team the longest time to investigate.
Do you see any patterns? Is the team asking the right questions? You may need to deploy metrics first.
Expel believes that effective investigations are rooted in the quality of questions asked, so we look for where our analysts are asking the same great questions over and over again.
For example, analysts may find themselves continuously asking questions like: Where has this user previously logged in from? At what times does the user normally log in?
And guess what machines are good at?
Yup – doing the same thing over and over without a break.
It really helps to have good SOC metrics and instrumentation in place before you start down this path. Be strategic by defining where you want to get to and measuring it. Look at metrics and build a cadence around it.
Keep in mind that finding great SOC metrics doesn’t have to be a complicated endeavor. You just need a group of people sitting down and understanding what’s happening. If you do this, you’ll be in the best position to answer which class of investigation takes the team the longest, and what steps you can automate to make life easier for the team.
That said, resist the urge (and encouragement by some) to automate all the things before you have metrics and understand what it’s like to do those activities manually.
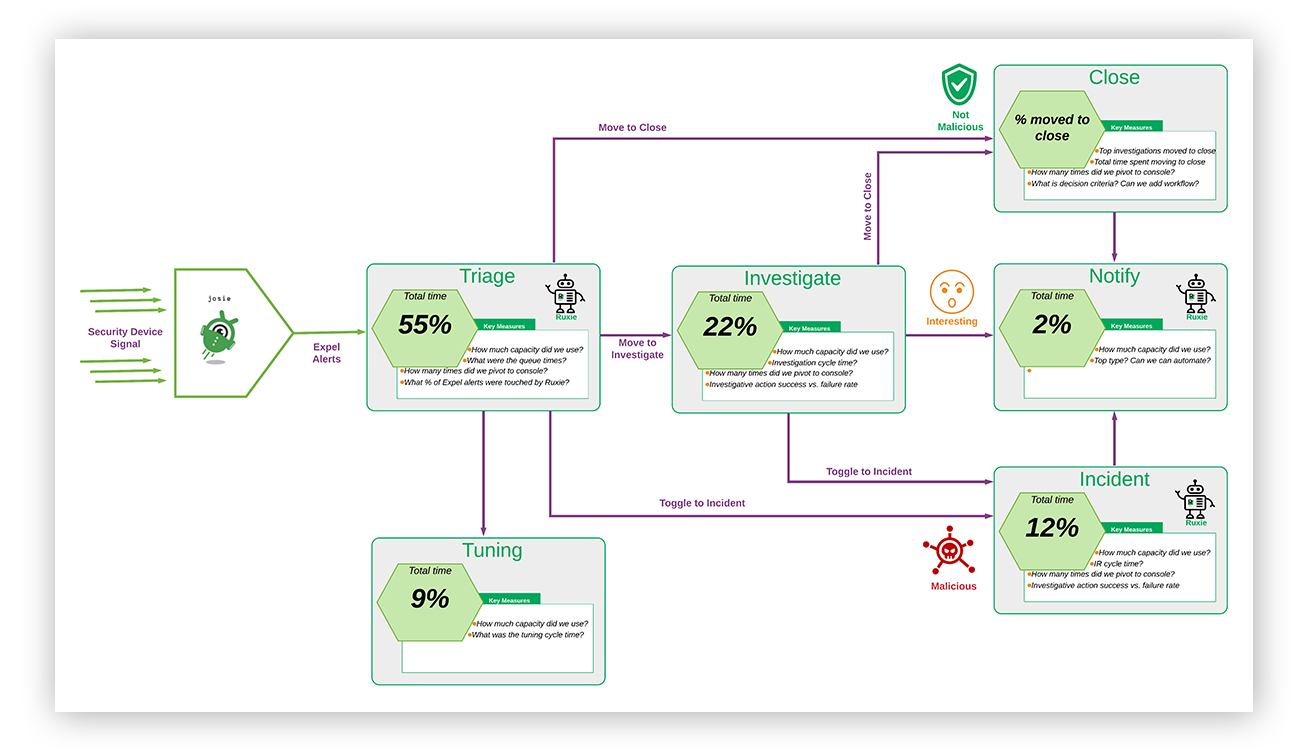
To help you calibrate, below is a high-level diagram of our own alert management process.
Expel SOC system diagram
And here are some Cliff’s notes on how to interpret the diagram above:
- There are six paths. Each path contains a percentage of the capacity utilization for the month recorded.
- Robots: You’ve heard us mention our robots in previous posts. We ingest security signals from a wide variety of tech and process those events through our detection engine (you’ll notice in the diagram above that we’ve named this robot Josie).
- Triage: Security events that match a specific criterias generate an alert that is sent to a SOC analyst for human judgement. You see in that diagram that 50 percent of the capacity we utilized was spent here for the month recorded.
- An alert can take one of three paths:
- Close: The alert is a false positive. Nothing to see here.
- I can also mark when “Tuning” is required on an alert.
- Incident: The alert is a true positive. Move to incident and respond.
- Investigate: After looking at the alert, I’m not sure. I need additional data before I make a call.
- An Investigation can take one of two paths:
- Close: After additional investigating, the alert was in fact a false positive.
- Notify: After additional investigating, the activity in question is suspicious enough where we’d want to tell a customer about it.
- An Investigation can take one of two paths:
- Close: The alert is a false positive. Nothing to see here.
We then have a set of metrics for each phase. Some of the metrics are the usual suspects, like the time between when an alert is fired and when an analyst picks it up. But when we’re looking for decision support opportunities there are two metrics that we zoom in on:
- What’s the percentage of alerts, based on the alert type, that move to the investigate bucket? Recall our SOC diagram above. We’re examining the pathway of alerts. Do we move “Suspicious Login” alerts to the investigation bucket 50 percent of the time? This suggests that there’s not enough information in the alert to make a call. We then ask: What information is needed? Can we use the data available from various vendors to bring that decorate the alert so that it can be handled in the “triage” bucket? Or can we use orchestration to go and fetch that one piece of evidence we need to make a call? We optimize triage for speed, efficiency and accuracy because that’s where we spend most of our time. It’s also a key way we reduce cognitive loading on our SOC analysts.
- When we move a class of alert to the investigation bucket, how long does it take for the SOC to complete it? We’re talking about investigation cycle time. If it’s taking us more than an hour to complete the investigation into a class of activity, what steps can we automate to improve these times? We’ll go and review the investigations to see what steps our analysts are taking. Once we spot a pattern, that’s the right one, we’ll hand the work off to our robots to do it for us.
Note that we never put a timer on our analysts. If it takes us more than an one hour to investigate a class of activity, we use data to spot it and then lead with tech to improve our cycle times.
Finally, we review the metrics weekly to monitor progress and spot areas where we need additional tech to improve.
Case Study: Suspicious Logins
Time to put all of this into practice.
Remember to keep our two key metrics in mind – high likelihood to move to “investigate” and time spent on investigation.
We spotted suspicious logins to applications/consoles in the cloud (things like O365 and AWS console authentications). As any security analyst knows, this is a class of alert that’s particularly painful.
What makes up a suspicious login?
To keep things simple it’s a class of alerts where an authentication is flagged based on context we have from the customer (for example customers tell us where they have employees). We also take into account things like whether it’s from a known suspicious region, or if it’s perhaps being accessed through a VPN.
It’s important to note that because our analysts are reviewing the alerts, our willingness to open the aperture of what makes a login suspicious is higher than if we were simply tossing alerts over the fence for our customers to review (which is the opposite of what Expel does).
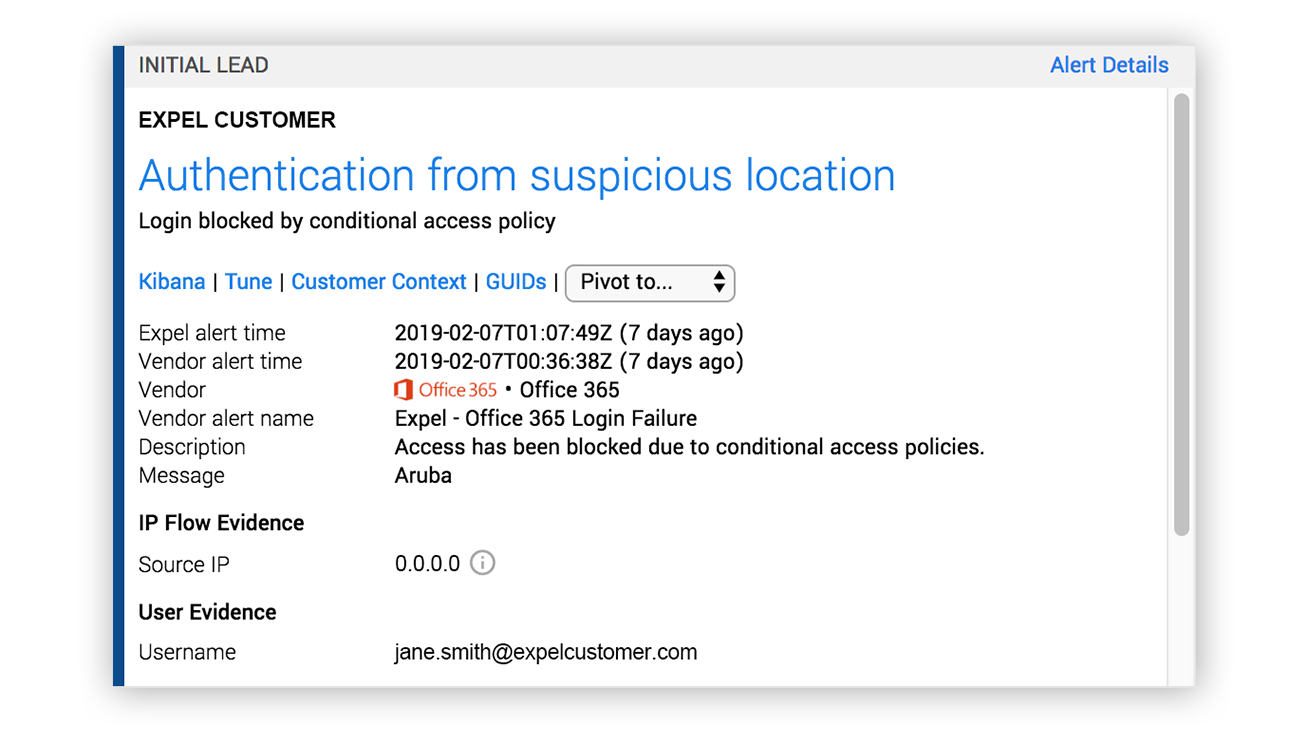
Here’s an example where O365 recorded a failed login from a foreign country due to a conditional access policy:
Expel alert for suspicious login pre-optimization
Just like any other alert, this is a collection of observations that something may be amiss.
Does this tell us anything special? Nope.
Let’s see if we can answer some of the right questions based on the class of activity using only the evidence within the alert:
| Key question | Able to answer just based on the alert? |
|---|---|
| 1. Where has this user previously logged in from? | [font_awesome icon=times] |
| 2. What other accounts has this IP logged into? Were they successful? | [font_awesome icon=times] |
| 3. Is this user based out of Aruba? Did they forget to authenticate to the corporate VPN before logging into O365? | [font_awesome icon=times] |
Can we answer key questions by looking at the alert? We sure can’t.
And so unsurprisingly, a high percentage of alerts related to suspicious login activity were making their way to our investigation bucket.
Further, when we examined our alert pathway metrics for suspicious login alerts they told us that about half the time our analysts would spend a ton of time querying SIEM logs and performing other steps to answer key questions. Below are the alert pathways of interest for Suspicious Logins alerts from May 2019:
| Alert pathway | % of alerts following pathway (pre automation) |
|---|---|
| Alert-to-close | 61% |
| Pursue as investigations | 39% |
As a next step we examined suspicious login investigations for patterns.
We wanted to answer this question: When we move a suspicious login alert to an investigation, what steps are we taking?
You can imagine that we were spending a ton of time querying logs in a SIEM to answer the same questions over and over again.
We noticed we were spending a ton of time answering the following:
- Where did the user log in from last?
- What’s the IP usage type for the source IP address?
- At what times does the user normally log in?
- Where has this user previously logged in from?
- What user-agent was previously observed for this user?
- What other accounts has this IP logged into? Were they successful?
- What’s the users role? Are they a member of any groups that could indicate they travel?
- Do they typically use a VPN? If so, which ones have we seen?
So, the conclusion we arrived at was that if these are the questions we need to answer to make sure we’re making the right decision, we’ll bring this info to the alert automatically.
As soon as the alert is generated, our robots (investigation orchestration) will pick it up, grab the data and present it as decision support. Our SOC analysts focus their efforts on making judgement calls and less time grepping through a SIEM.
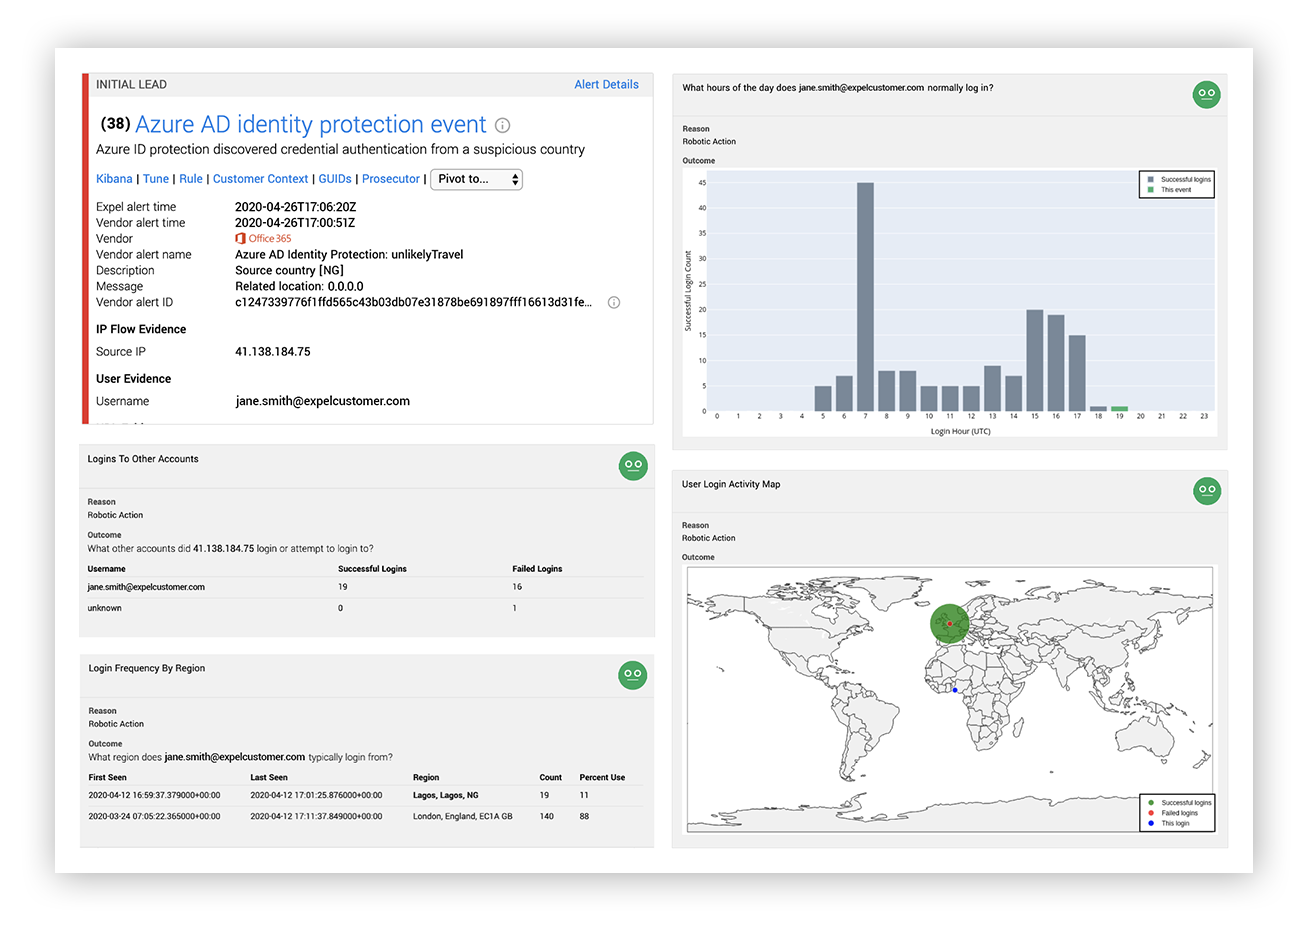
Now when a suspicious login alert fires instead of only presenting the evidence from the alert we use automation to add lots of decision support:
Expel alert for suspicious login post-optimization
What work do we automate?
When a suspicious login alert fires, our robots go and grab:
- A user authentication histogram that shows at what times a user is normally observed logging in over the past 30 days.
- A user login activity map that shows the geolocation of previous successful logins, unsuccessful logins and the current login for the user in a weighted bubble map over the past 30 days.
- A summary of authentication attempts (success and failure) from the source IP address recorded in the alert.
- A login frequency summary for the user based on region. This shows how often the user is logging in from different IP addresses and the frequency of those logins
- A user agent summary. This shows the user-agents recorded for the user over the past 30 days.
- Our robots also grab user details from O365 or G-Suite and MFA device activity to arm our analyst with more context.
By asking the right questions and then handing the heavy lifting off to our robots, most suspicious login alerts can be triaged in a matter of minutes.
Here are the post automation alert pathway stats for May 2020.
| Alert pathway | % of alerts following pathway (post automation) |
|---|---|
| Alert-to-close | 86% (+25%) |
| Pursue as investigations | 14% (-25%) |
We’ve made a once painful class of alerts much easier to handle and that’s a great outcome for our SOC analysts and our customers.
Parting Encouragement
Ask the right questions; achieve the desired result. That’s why we created decision support. It makes it super easy to answer the right questions.
Remember, decision support is not sticky notes. It starts with a group of people sitting down and understanding what’s happening and where we need to adjust. It really helps to have good SOC metrics in place before you start down this path. Draw the big picture and start to zoom in on areas where you think the team might be struggling.


