A head of a SOC team, an analytics engineer and a data scientist walk into a bar (or a Zoom chat nowadays) …
Okay, so maybe it wasn’t a bar, but we did come together to chat about metrics.
The result is this three-part blog series.
That’s right – three blog posts! It’s hard to cover all things SOC efficiency and leadership in just one post. And given that we’ve been receiving a lot of questions around SOC metrics, we thought it would be helpful to spend some time defining what we mean by SOC metrics and how they are used to make sure our customers – and our team! – remain happy.
The truth is: a lot of SOC burnout is the result of ineffective operations management. A SOC can be a great place to work. At Expel, metrics are more than measurements. Metrics help us take care of the team.
Here’s what we’ll cover:
- In this first post, we’ll share our thoughts on how to set up a measurement framework that helps SOC leads ensure goals are being met (and when they’re not).
- The second post will dive in a little deeper to explore how to avoid burnout by guarding the system against volatility.
- In our final post, we’ll share some IRL examples and what we did to achieve our aim.
What are cybersecurity SOC metrics, and why do we need them?
Setting up a way to measure success is important to making sure you have an effective SOC.
The way we see it, great leaders organize their teams around a compelling goal (or aim), arm the team with the right metrics to inform where they are in the journey and then get out of the way.
There’s no more strategic thing than defining where you want to get to and measuring it.
Strategy informs what “great” means and measurements tell you if you’re there or not.
In this post, we’re going to discuss how to create a strategy with a clear aim, share the metrics we use here at Expel to measure the efficiency of our SOC, along with each team member’s unique perspective on why these measurements work.
After hearing from our team, you’ll be able to apply our approach as you establish goals for your own SOC.
Create your cybersecurity metrics strategy
A strategy starts with a compelling aim.
To keep it simple: Goals are things you want, strategy is how you’re going to get there and measurements tell you where you are in that journey.
If you don’t have an aim you might fall into the trap of measuring just to measure and the result could be a lot of work with no progress.
Let’s say you have your compelling aim of where you want to get to. You know what you want to measure.
But do you have the data you need to measure?
Before you can create great metrics you need to start with good, reliable data.
So where should you get that data?
In our case, our SOC analysts use a platform called Expel Workbench to perform alert triage, launch investigations and chase bad guys. We track a lot of the analyst activity and the data from that activity is accessible to us through our APIs. Through those APIs we can pull info like arrival time of an alert, the time when an analyst started looking at an alert, when an analyst closed an alert and more.
It’s important to note that while sometimes it’s certainly okay to start by measuring the data you have available, we recommend that you understand what you want to measure (informed by your strategy) and invest the time, effort and energy in making that data available.
To build, maintain and scale the Expel SOC we set clear aims, arm the team with Jupyter Notebooks, use data for learning and then iterate.
Here’s our formula for success:
Clear aims + ownership of the problem + data for learning + persistence = success
Define your goals
These are the aims we identified for the Expel SOC metrics:
- Has a firm handle around capacity: We know how much total analyst capacity we have, what the loading was for any given day or month, and we’re able to forecast what loading will look like in the future based on our anticipated customer count. This will tell us how we’re going to scale.
- Responds faster than delivery pizza: Thirty minutes or less to spot an incident and provide our customers steps on how to fix the problem.
- Improves wait times: Almost everything we touch in our SOC is latency sensitive. Wait times should improve.
- Improves throughput: If we’re performing the same set of analyst workflows again and again, let’s identify that and automate the repetitive tasks using our robots.
- Measures quality: Has a self-correcting process in place and finds opportunities for improvements and automation.
Now that we’ve shared our goals, let’s talk about metrics.
Develop cybersecurity metrics
Next we’re going to walk you through three metrics we think are fundamental to managing a SOC:
- When do alerts show up? (alert seasonality)
- How long do alerts wait before a robot or an analyst attends to them? (alert latency)
- How long does it take to go from alert to fix? (remediation cycle time)
These metrics are key to measuring efficiency because they tell you when work shows up, how long work waits and how well the system is performing.
W. Edwards Deming once said, “Every system is perfectly designed to get the result that it does.”
If we’re slow to respond to alerts or incidents (30 minutes or less in our SOC), we know there’s a flaw in the system. These three metrics help us understand how we’re performing.
For each measurement, we’ll provide our perspectives on why we measure (from Jon, Expel’s SOC lead) and how we build and optimize those measurements (from Elisabeth, Expel’s data scientist, and Mor, Expel’s analytics engineer).
Metric #1: When do alerts show up?


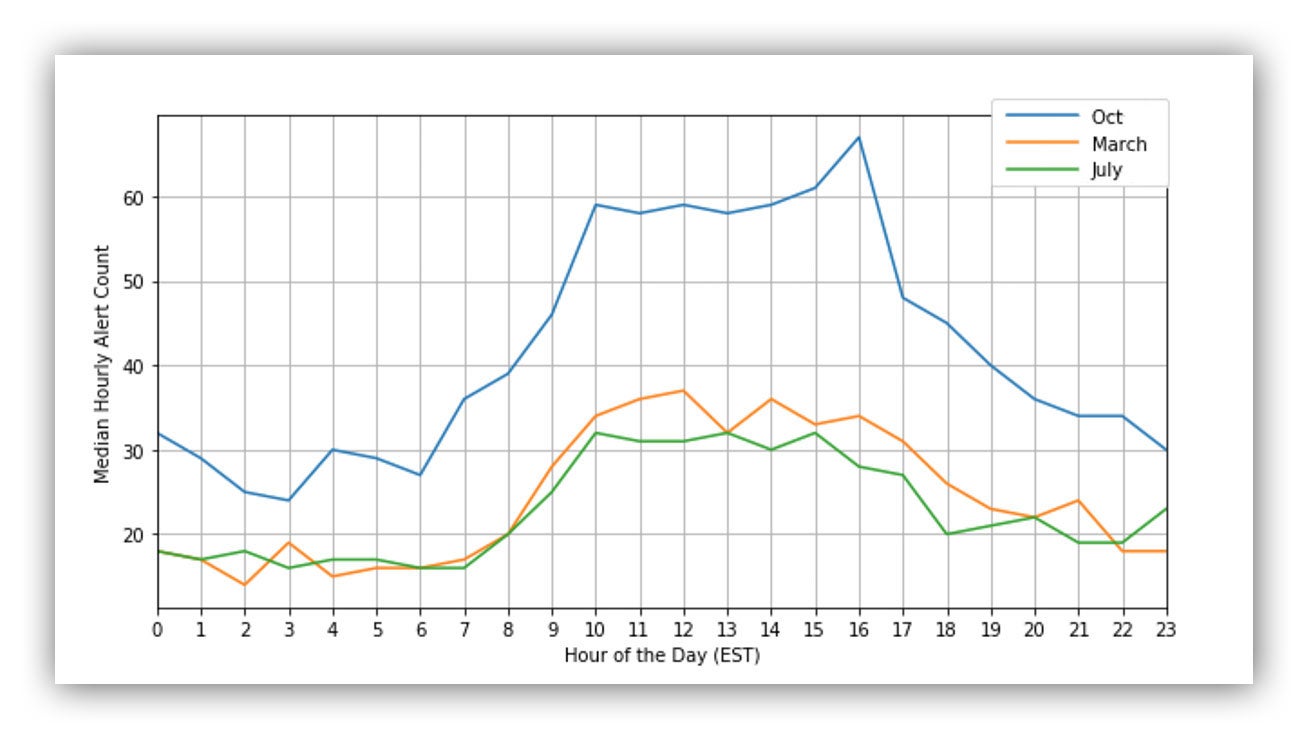
We started by simply looking at the median hourly alert count. Using this metric, we see at what times of day our volume spikes the most, and in turn, when we need to staff the most analysts.
This is something we continue to track over time, and as you can see in the graph below, the pattern changed. The blue line shows the hourly counts for October 2019, the orange line shows the hourly counts for March 2020 and the green line shows hourly counts for July 2020.
October data peaked between 10 a.m. and 4-5 p.m. ET. However, by March we started to see that line flatten a little and this trend continued into July. As we’ve added more West Coast and international customers, our load became more consistent throughout the day.
Median Hourly Alert Count in October 2019 vs. March 2020 vs. July 2020
We saw this shift happening thanks to the fact that we use alert seasonality as a metric. As a result, we were able to proactively staff more analysts later into the day to avoid any overload.
Metric #2: How long do alerts wait?

If alerts latency times are high this tells me one of three things is happening: we don’t have enough capacity to keep up, we’re spending too much time chasing bad leads or we’re over subscribed responding to incidents.
The key here is to set wait time goals – you may call these Service Level Objectives (SLOs) – then monitor and adjust. You don’t want to tune to your relative capacity here. The trick is to find where you can use technology and automation to hit your targets and make this easy on the team.

- The time an alert entered the queue; and
- The time when that same alert was first actioned.
If an alert entered the queue at 11 a.m. ET and the first action was performed 20 minutes later, the alert latency is 20 minutes.
We measure alert latency for every alert that enters the queue to understand how long alerts are waiting and if we’re within tolerance of our SLOs.
Alert latency is important within the context of SOC operations. If you’re considering setting an aim to pick up alerts fast – consider these two key factors.
- Measure the 95th percentile – not the median: At Expel, when measuring alert latency, we use the 95th percentile. So in essence, our metric helps us understand how long alerts wait before first action 95 percent of the time. If we were to use the median latency, that’d only tell us how long alerts wait 50 percent of the time. In doing so we may think we’re more effective than we really are. Bottom line: Use the 95th percentile or higher to understand alert latency.
- Not all alerts are created equal: Alerts show up with different severities. Each severity has a different SLO. At Expel an alert can be labeled with one of five different severities:
-
- Critical
- High
- Medium
- Low
- Tuning
The easiest way to think about severity is confidence + impact = severity. If I’m confident that when an alert fires it will be a true positive AND it will lead to really bad outcomes for a customer, the alert will be labeled with a critical severity. We’ll set an SLO that our SOC will pick those up within five minutes. The SLOs increase in time as we become less confident that the alert will be a true positive. When I built this metric understanding that I needed to slice and dice on alert severity was super important.
We track alert latency weekly and monthly broken out by severity. When we review alert latency as part of our weekly check, we’ll record our performance in a simple table (like the one below):
| Alert Latency |
|---|
| Alert Severity | SLO | 95th % |
|---|---|---|
| Critical | 5 minutes | |
| High | 15 minutes | |
| Medium | 2 hours | |
| Low | 6 hours | |
| Tuning | 12 hours |
Alert latency table
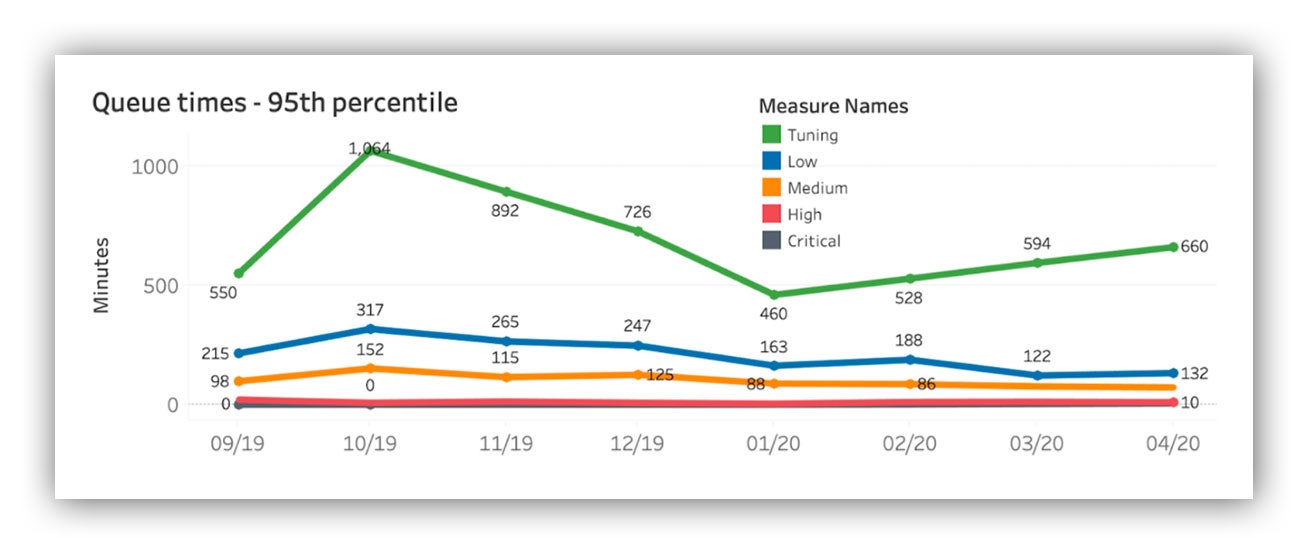
When reviewing alert latency on a month-to-month basis, trending out performance in a time series distributed by severity allows us to spot performance issues.
For example, if our SLO times for low severity alerts start to increase, we know if we don’t act we’ll likely see our medium, high and critical SLO times degrade.
Our lower severity SLO times act as a leading indicator. The key is to monitor and adjust.
Alert latency time series summarized monthly broken out by severity

You need to understand the work that’s showing up, optimize detections, tune and apply filters where needed and automate. We wrote a blog post on how our SOC analysts use automation to triage alerts, in case you’re interested in learning more about how that process plays out.
Metric #3: How long does it take to go from alert to fix?

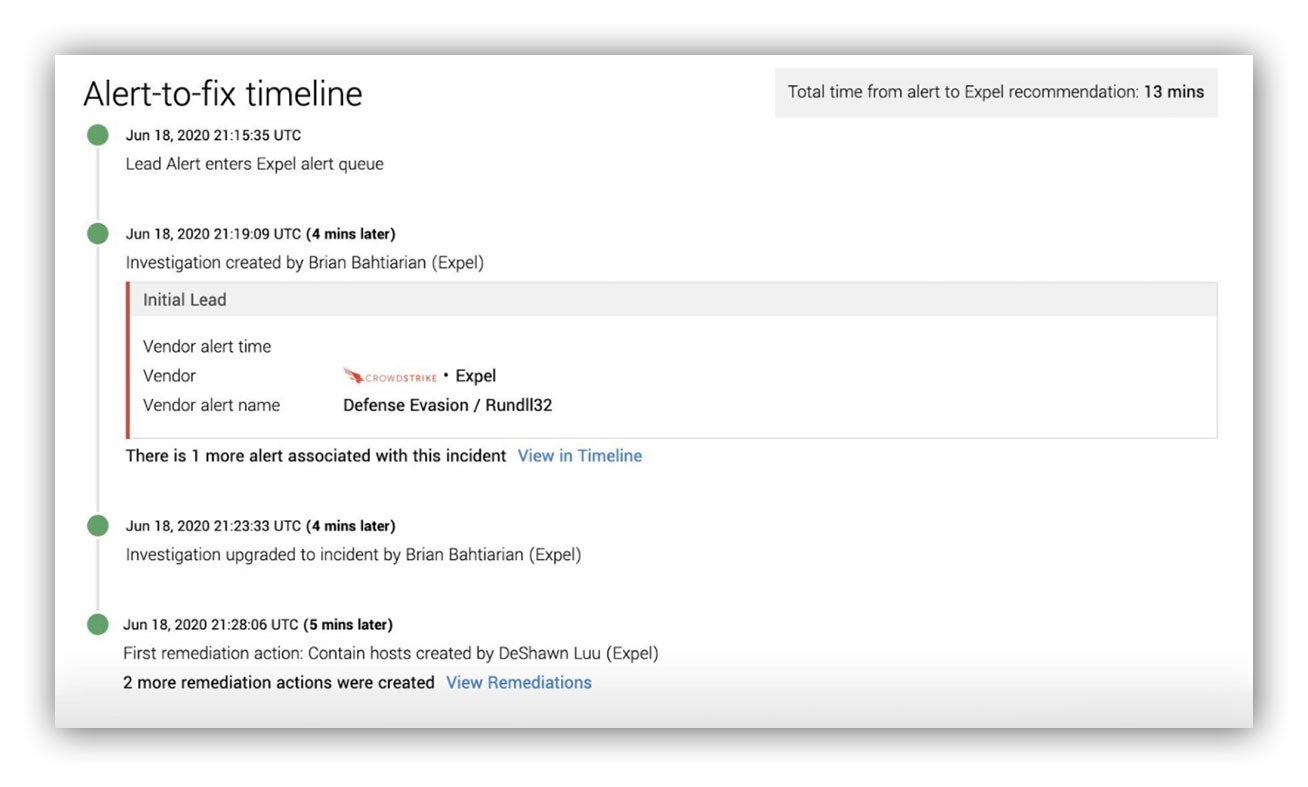
I believe that speed matters when dealing with an incident and measuring alert-to-fix times is a good way to understand SOC performance. In fact, we provide this metric in every incident “Findings” report to our customers.
Alert-to-fix timeline – included with every Expel incident “Findings” report
We review alert-to-fix times weekly and anytime we don’t meet our mark of 30 minutes or less, we take a look at an incident and find ways to improve. It’s data for learning.
You may be thinking: but what about quality control? When optimizing for speed I highly recommend you back that with a quality control program.

- The time an alert entered the queue; and
- The time the first remediation recommendations were provided to the customer.
When we talked about alert queue times we mentioned that we label alerts with a severity (there are five) and that severity is a notion of confidence + impact. How this plays out in practice is that most of the time when an alert labeled with a “critical” or “high” severity fires, it means most of the time we spotted a threat vs. a false positive condition. Not necessarily all of the time, but most of the time. This allows us to measure and optimize wait times.
We take a similar approach with incident remediation cycles times. We break out incidents into four categories:
- Non-targeted incidents (think commodity malware – Hello, EMOTET!)
- Targeted incidents (the bad guy wants to break into your organization
- Business email compromise (there’s so much of this it has its own class)
- Policy violations (someone did a thing that resulted in risk for the org)
This allows us to understand how quickly we’re able to respond based on the type of incident we detected.
Are alerts waiting in the queue for non-targeted incidents? Are we spending too much time fighting the SIEM to figure out how many users received that phishing email? How much time are we spending writing an update vs. investigating? Can we optimize that? It all matters.
We break out incident remediation cycle times by the class of incident, inspect what’s happening and use the data to learn and improve.
Here’s an example of how we optimized incident remediation cycle times for Business Email Compromise incidents. TL;DR – We automated alert triage, investigation, the response and optimized how we communicate information to our customers. Our SOC analysts focus on making complex decisions and we use tech for the heavy lifting.
Knowing how long the work takes is a good first step – but break the data out into buckets to help you understand where to get started.
You’ve got your goal and your data … what now?
Before you “measure all the things” remember to have a compelling aim. If you don’t and just measure what’s available you may be optimizing for the wrong outcome – doh!
After we defined our strategy we talked about fundamental metrics to know when alerts show up, how long they wait and how long it takes to spot an incident and provide our first recommendation on how to stop it.
In our next post, we’ll talk about the metrics we use to monitor the SOC end-to-end system as a whole.
In our final post we’ll share SOC metric success stories.
Make sure you subscribe to our blog so that you’ll get the posts in the rest of this series sent right to your inbox.
Resource sharing is caring
Want a TL;DR version of this for quick reference in the future?
Expel’s SOC management playbook:
- Define where you want to get to (your strategy)
- Deploy measurements to help guide you and the team
- Learn how to react to what the measurements are telling you
- Iterate
- Persist
- Celebrate


