Blog
Company news
Expel named a Leader in The Forrester Wave™: MDR Services, Q1 2025Expel named a Leader in The Forrester Wave™: Managed Detection and Response Services, Q1 2025 and received 5/5 scores in 15 categories.

Rapid response | 2 min read
Security alert: Citrix NetScaler ADC and NetScaler Gateway vulnerabilities allow unauthorized accessCitrix released two vulnerabilities (CVE-2025-5777 and CVE-2025-6543) that impact NetScaler ADC and NetScaler Gateway. Here's what to know and what to do.

Cloud security | 3 min read
Cloud Decoded (part 2): What attackers don’t want you to knowThis is part two of Expel's blog series on decoding the cloud. It dives in to what attackers don't want you to know.

Current events | 3 min read
What we’re seeing from Iran (and what it means for you)Here's Expel's take on what the geopolitical issues between the US, Israel, and Iran look like for the cybersecurity community to date.
Current events | 2 min read
Key takeaways from AWS re:Inforce 2025Expel recently attended the 2025 AWS re:Inforce conference, where our CEO David Merkel spoke at AWS Security Live. Here's what we learned.

Product | 5 min read
Explore Expel’s auto remediations: Delete registry keyIn this series, we explore Expel's auto remediations so you understand how they work. Let's explore delete registry key.

MDR | 5 min read
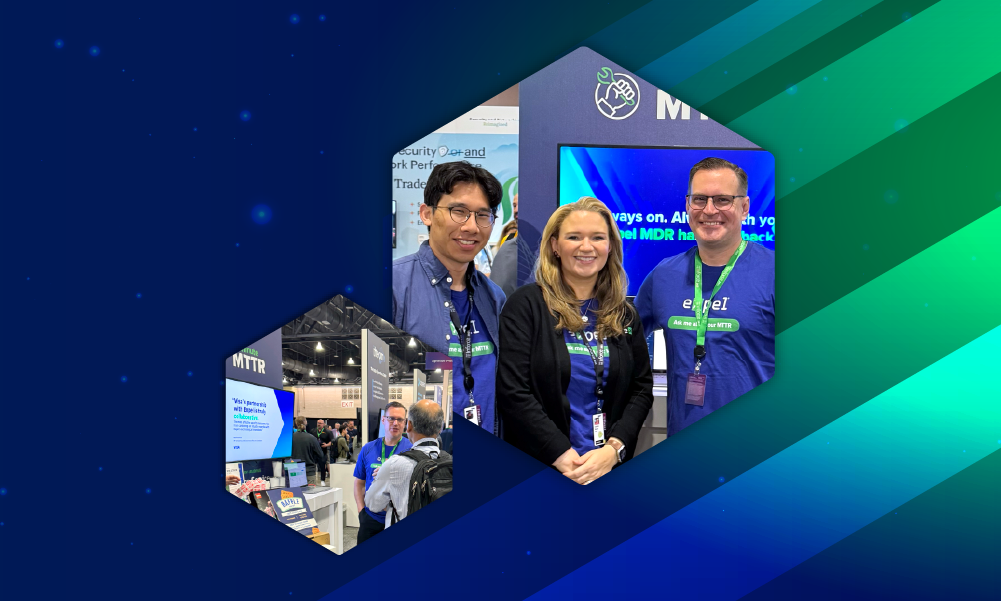
Insights on the MDR market from the Gartner® Security & Risk SummitExpel attending the Gartner Security & Risk Summit. Here are the insights we gathered on the MDR market post-conference.

Rapid response | 2 min read
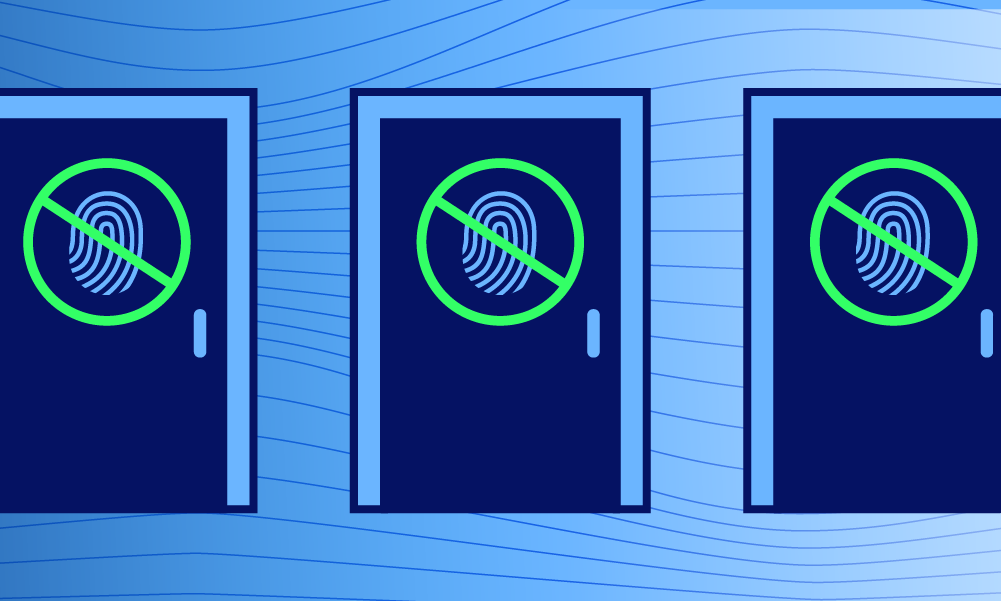
Scattered Spider’s heightened activity—here’s the 411Threat group Scattered Spider is making headlines again as they increase targeting for financial services and insurance orgs.

Product | 5 min read
Explore Expel’s auto remediations: Delete malicious fileIn this series, we explore Expel's auto remediations so you understand how they work. Let's explore delete malicious file.

Expel culture | 3 min read
Meet the Expletive: Hafsah Mijinyawa, Senior Motion DesignerMeet Hafsah Mijinyawa, Senior Motion Designer at Expel. Hafsah is a seasoned storyteller who shares her art through visuals.

Current events | 4 min read
Staying secure through M&A: A conversation with VisaGet tips from experts at Visa and Expel to keep your org safe and secure through mergers and acquisitions (M&A).
Product | 5 min read
Explore Expel’s auto remediations: Block bad hashIn this series, we explore Expel's auto remediations so you understand how they work, and the benefits of each. Let's explore block bad hash.

Data & research | 3 min read
Are attackers retooling?Vulnerability exploitation as an initial access vector is up year-over-year, and attackers are shifting strategies, so what gets prioritized?