
TL;DR
- Scale allows for improved visibility, when allowing aggregated incident data to add context even across organizations
- This leads to an ever-expanding detection strategy, covering the gaps you didn’t know you had
- This blog provides an overview of how we group large data sets here at Expel. Expel’s large volume of incident data gives everyone involved better coverage
When most people think of managed detection and response (MDR) services, they think of a team of analysts keeping a watchful eye on customers’ networks, trained to detect unusual behavior, identify if it’s an attack, and block it if so.
They’re not wrong—that’s a large part of what we do here at Expel. But that only tells part of the story. Pull that curtain back, and behind the front lines of highly skilled analysts, you’ll find a sizable team of top-tier engineers comparing and contrasting incidents, looking for patterns, and writing detections to catch similar malicious activities across our customer base.
This is what good MDR companies do. But this is still only one peak on the MDR mountain. The ultimate summit only comes with scale.
Detection at scale
In the very beginning at Expel, a company like ours gets to see only one customer’s users, idiosyncrasies, software stack, and any attackers that might take an interest in them. That view expands when signing your fiftieth or hundredth customer—a single user agent that didn’t previously seem terribly unique now stands out as genuinely anomalous among this larger sample. Larger scale brings a new, fuller perspective.
This scale has allowed Expel to become very good at aggregating a large volume of incident data into actionable intelligence. This information becomes a sort of meta detection, where two incidents on two different customers can lead us to a previously unseen incident at a third customer.
This translates into further detections traditional tooling may not uncover. There are always attacks that slip through a customer’s defenses. Thankfully, with Expel’s greater visibility across hundreds of organizations, we’re often able to see and intervene before an attacker gets too comfortable. When this occurs, we alert the customer to this newfound activity, offering remediation suggestions and advice on how to prevent the activity in the future.
Surfacing patterns
To do this, we aggregate the data to surface patterns. While we group things to manage the sheer volume of IP addresses we see, this grouping effort also gives us the opportunity to sort by several well-worn paths.
Though you can definitely add to this list of common patterns, we often see attackers do the following:
- If they can access a second user, they will look for a way to do so
- If they can easily change their IP address, they will try to do so
- If they can keep their infrastructure under one provider, it’s easier for them to build and maintain it
These points don’t cover all of what an attacker might value, but it helps to use generalizations like this when grouping logins from a high level.
A technical example
Here’s a technical example of how this plays out in the real world. Let’s say you’re looking at IP addresses as they relate to suspicious logins. Investigating 400 IPs represents a huge amount of work on an individual basis. You could group activity by country, the number of users observed with a given feature, unique days on which they were observed, or simply IPs that begin with 181.177.x.x.
As we look for emerging threats, we often look at IPs in relation to the Autonomous System Numbers (ASNs) they appear within and ask, “Which ASNs are repeatedly popping up within our customers’ environments?”
After running a query of the previous 30 days to get a list of ASNs seen in two or more unique customer incidents triaged by our SOC analysts. Here’s some of the more interesting ASNs we found:
| Unique customers observed | AS number | ASN org name |
|---|---|---|
|
43 |
215540 | Global Connectivity Solutions LLP |
|
16 |
14061 | DigitalOcean, LLC |
|
14 |
36352 | HostPapa |
|
14 |
9009 | M247 Europe SRL |
|
11 |
62240
212238 19871 |
Clouvider
Datacamp Limited Network Solutions, LLC |
|
10 |
14628
16509 |
Amazon.com, Inc. |
|
9 |
8075 | Microsoft Corporation |
|
8 |
16276 | OVH SAS |
|
7 |
53667 | FranTech Solutions |
Some of you likely have seen IP providers such as “GLOBAL CONNECTIVITY SOLUTIONS LLP” or “FranTech Solutions” attempt to access your environment through a phishing email. Lots of us have had to decode whether logins from “Cloudvider” or “Datacamp Limited” were authorized VPNs or something else. Then there are strange cases like “Web2Objects LLC” IPs accessing Workday for employment verification. Authorized? Not authorized? Bad hygiene, for sure.
When sorting the unique customers in each ASN organization, GLOBAL CONNECTIVITY SOLUTIONS LLP appeared at the top of the list. (This makes sense, as Tycoon 2FA is prolific these days.)
While it isn’t displayed in the table above, we added a day field to see which days these attacks took place. Concentrations of both ASNs and nearby days are a reasonable correlation when finding adversaries and their infrastructure.
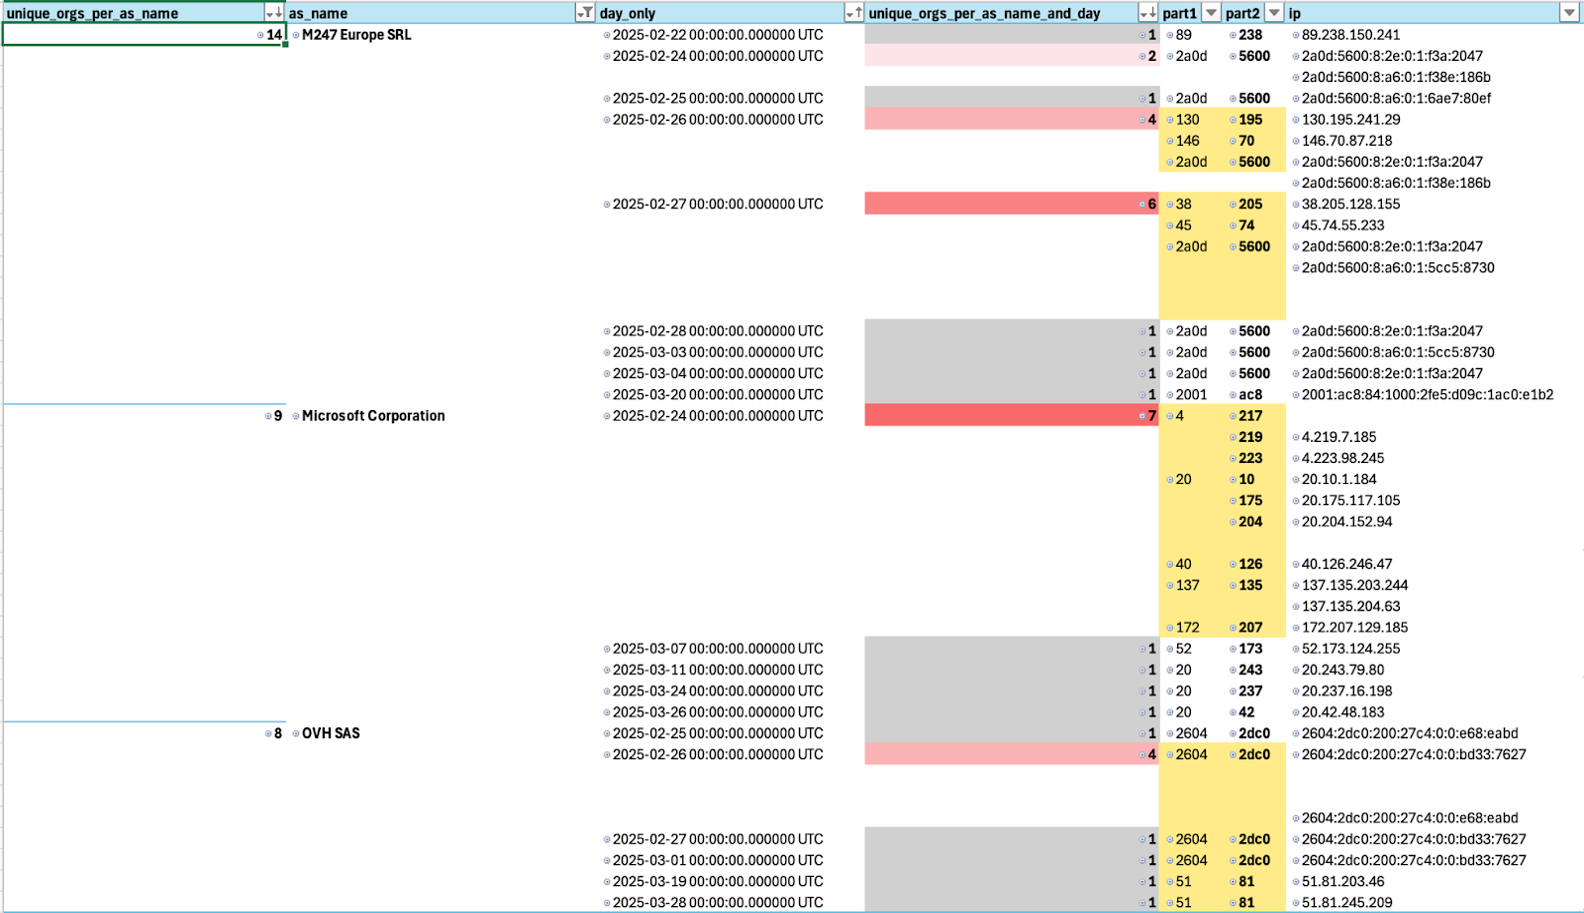
Note how “OVH SAS” was seen in incidents with four customers using three different IP addresses, all on the same day (shown above). This is a good indication of a bad actor doing stuff they shouldn’t, and at scale.
Let’s dive deeper into this by looking at the “Microsoft Corporation” ASN. You could, and probably should, do this with all the ASNs listed above—especially the ones with higher volumes. But for the sake of simplicity, we’ll look at the Microsoft ASN for illustrative purposes.
Microsoft can be a difficult ASN to keep an eye on because there are so many IPs hosted under their allocation and much of the activity is benign. But based on our scan data, there was a concentration of seven customers with attacks involving nine IP addresses in this IP space on the same day.
For big providers like Microsoft, we frequently parse out the IPv4 octets and IPv6 segments to make it easier to identify any other common features. Perhaps there’s an attacker-controlled subnet block of IPs being used in attacks. In this case, the first two octets (137.135.x.x and 20.204.x.x) were reused, targeting different customers and users. While not always helpful, this can work to isolate a smaller, more relevant portion of the IP space.
A quick scan of those IPs subnets uncovered attempts from 137.135.204.63 and 137.135.203.244 against two other customers that same day. These two appear to have resulted in successful logins that the customer’s security tooling didn’t alert on.
This is why we perform these types of exercises—to find malicious activity that tooling can’t and further improve detections for our customers.
After discovering these unremediated compromises, we were able to quickly hand these events to one of our hunting analysts to perform a full incident rundown and get the users remediated promptly—without impact to our customers.
Key takeaways
Further analysis confirmed that these were both successful attacks, which we could then mitigate for our customers. All thanks to this method for aggregating incident data to add context across organizations. Here are some key takeaways from this exercise:
- Explore aggregations in any form. They can be very useful in visualizing patterns. PivotTables are your friends here for exploring the data fast. Many common data tools like Python’s Pandas or Google Looker include PivotTable features that can assist you.
- Group your IPs from logins (and other activity) by ASNs and look for patterns. If you have a small(ish) environment, you may need to expand your time frame to find patterns.
- Group ASNs by a given day or session ID, and look for patterns like:
- Multiple ASNs for the same session ID or day
- A consistent group of ASNs for several users in one day
- A high number of unique ASNs on one day or using a single session ID can indicate brute force activity (or some other automated attack)
- If you’re scoping a bad IP address (137.135.203.244), try lopping off the last octet (137.135.203.x) to see if an attacker is only changing IPs within a subnet. This is a very good way to approximate the ASN, leasing organization, or server farm.
- Lastly, begin to think about how to gather lists of artifacts and count those lists across your environment or user base. It works well with IPs and ASNs, but it’s very useful in other areas too (event_type, region, etc.). For example, if you see OVH, DataCamp, and Microsoft hosting providers all show up as a login source for multiple users’ logins on a single day, this could help you spot the different attack phases (fake login page infrastructure, automated compromise confirmation, and human-attacker logins). Identifying this group of ASN sources, as opposed to individual ASNs, could be the key to seeing other users who have been successfully compromised.
Here at Expel the last—and arguably most important—step is this process after identifying the attacker’s infrastructure is looking at other features within the incident for common artifacts. Our goal is to find things that might help detect bad actors in the future, regardless of the IP space involved.
And here’s the best part: this correlated detection is just one example that has helped us identify previously undetected compromises in other customer’s environments. From this vantage point, at the summit of the mountain, we can see for miles.


