
Welcome to the latest installment of the Expel Quarterly Threat Report (QTR) for Q1 2024. If you’re new here, our QTRs provide data and insights on the attacks we’re seeing, how to spot them, and ways you can protect your organization.
If you’re not new here, this report will look a little different from past iterations. The contents of these threat reports distill the trends, notable new behaviors, and unusual attacks we saw over the past quarter—info we know is valuable for the other defenders out there. But we also know firsthand that operators are extremely busy, and finding the time to digest extensive analysis isn’t always easy.
So we’re making it easier.
These new QTRs will contain all the same incident findings, trends, and takeaways, just in the form of a snackable blog series. Throughout this series, our goal remains the same: by sharing how attackers got in, and how we stopped them, we’ll translate the security events we detect and remediate into strategy for your organization.
To kick things off, let’s talk about Q1 by the numbers.
TL;DR
The trends in our QTR are based on incidents our security operations center (SOC) identified through investigations into alerts, email submissions, or threat hunting leads in the first quarter (Q1) of 2024. We analyzed incidents across our customer base, which includes organizations of all sizes, in many industries, and with differing security maturity levels. In the process, we sought patterns and attacker tendencies to help guide strategic decision-making and operational processes for your team.
Top 4 takeaways from Q1
- Attackers mostly use AI to aid in social engineering attacks.
As AI’s capabilities expand, social engineering attacks are likely to grow in both volume and complexity, usually targeting the weakest link in the equation: humans. Organizations need to protect against increasingly sophisticated attacks, or prepare to shoulder the consequences. - Two-thirds of malware incidents were considered high-risk, representing pre-ransomware and exfiltration attempts.
The skilled actors behind these malware groups aren’t going away. Identifying malicious activity quickly and effectively is your best bet for staying ahead of potentially devastating attacks. - Attackers increasingly use hosting providers to disguise details of their attempts.
Criminals use hosting providers to manipulate their activity’s geolocation to appear closer to their victims and disguise anomalies, makes it more difficult to detect and track. It’s also a relatively cheap and easy (thus attractive and effective) avenue for attackers to provision new resources (including new IPs or domains)—and one for operators to watch. - It’s critical to prioritize patching as soon as a severe vulnerability is identified.
Our SOC team identified 17 severe vulnerabilities in Q1, each representing a significant risk (with attackers leveraging several soon after disclosure). But vulnerabilities aren’t only dangerous after they’re publicized—they were potential threats lurking under the surface for months (sometimes years). Understanding your potential attack surface and having the ability to retroactively identify signs of exploitation are key to ensuring your network is secure.
Q1 by the numbers
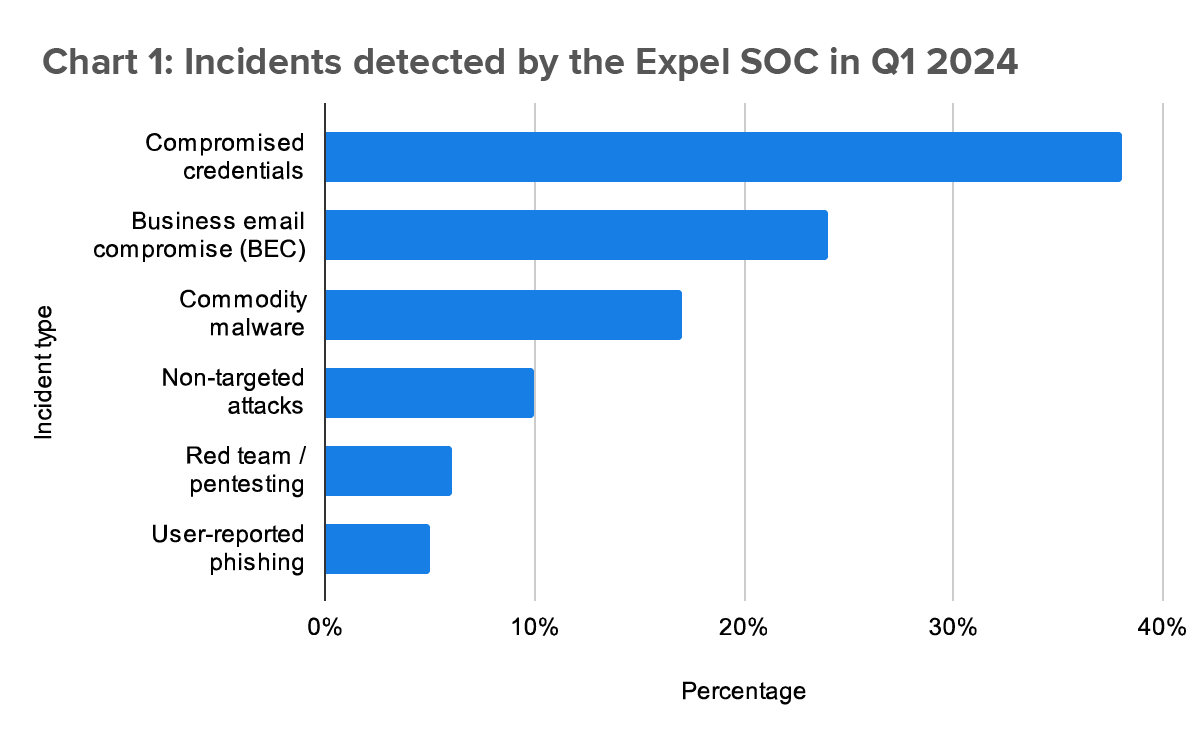
- Identity-based attacks (account compromise and account takeover [ATO]) accounted for 61% of all incidents our SOC identified.
In the context of this report, we define identity threats as attackers attempting to gain access to a user’s identity to perpetuate fraud. Identity-based attacks are consistently the predominant threat our SOC sees. (Check out our 2024 Annual Threat Report for more details.)
- Attackers deploying commodity malware (including malware families linked to pre-ransomware operations) accounted for 16% of the incidents our SOC observed in Q1.
- Authorized penetration tests and red team/purple team exercises comprised just over 6% of incidents. Over the last two years, these tests consistently accounted for 4-8% of total incident volume.
- Incidents in cloud infrastructures (we monitor AWS, GCP, Azure, and Kubernetes) made up only 3% of the total incident volume. Misconfigurations and accidental public-access key exposure were the most common causes of incidents.
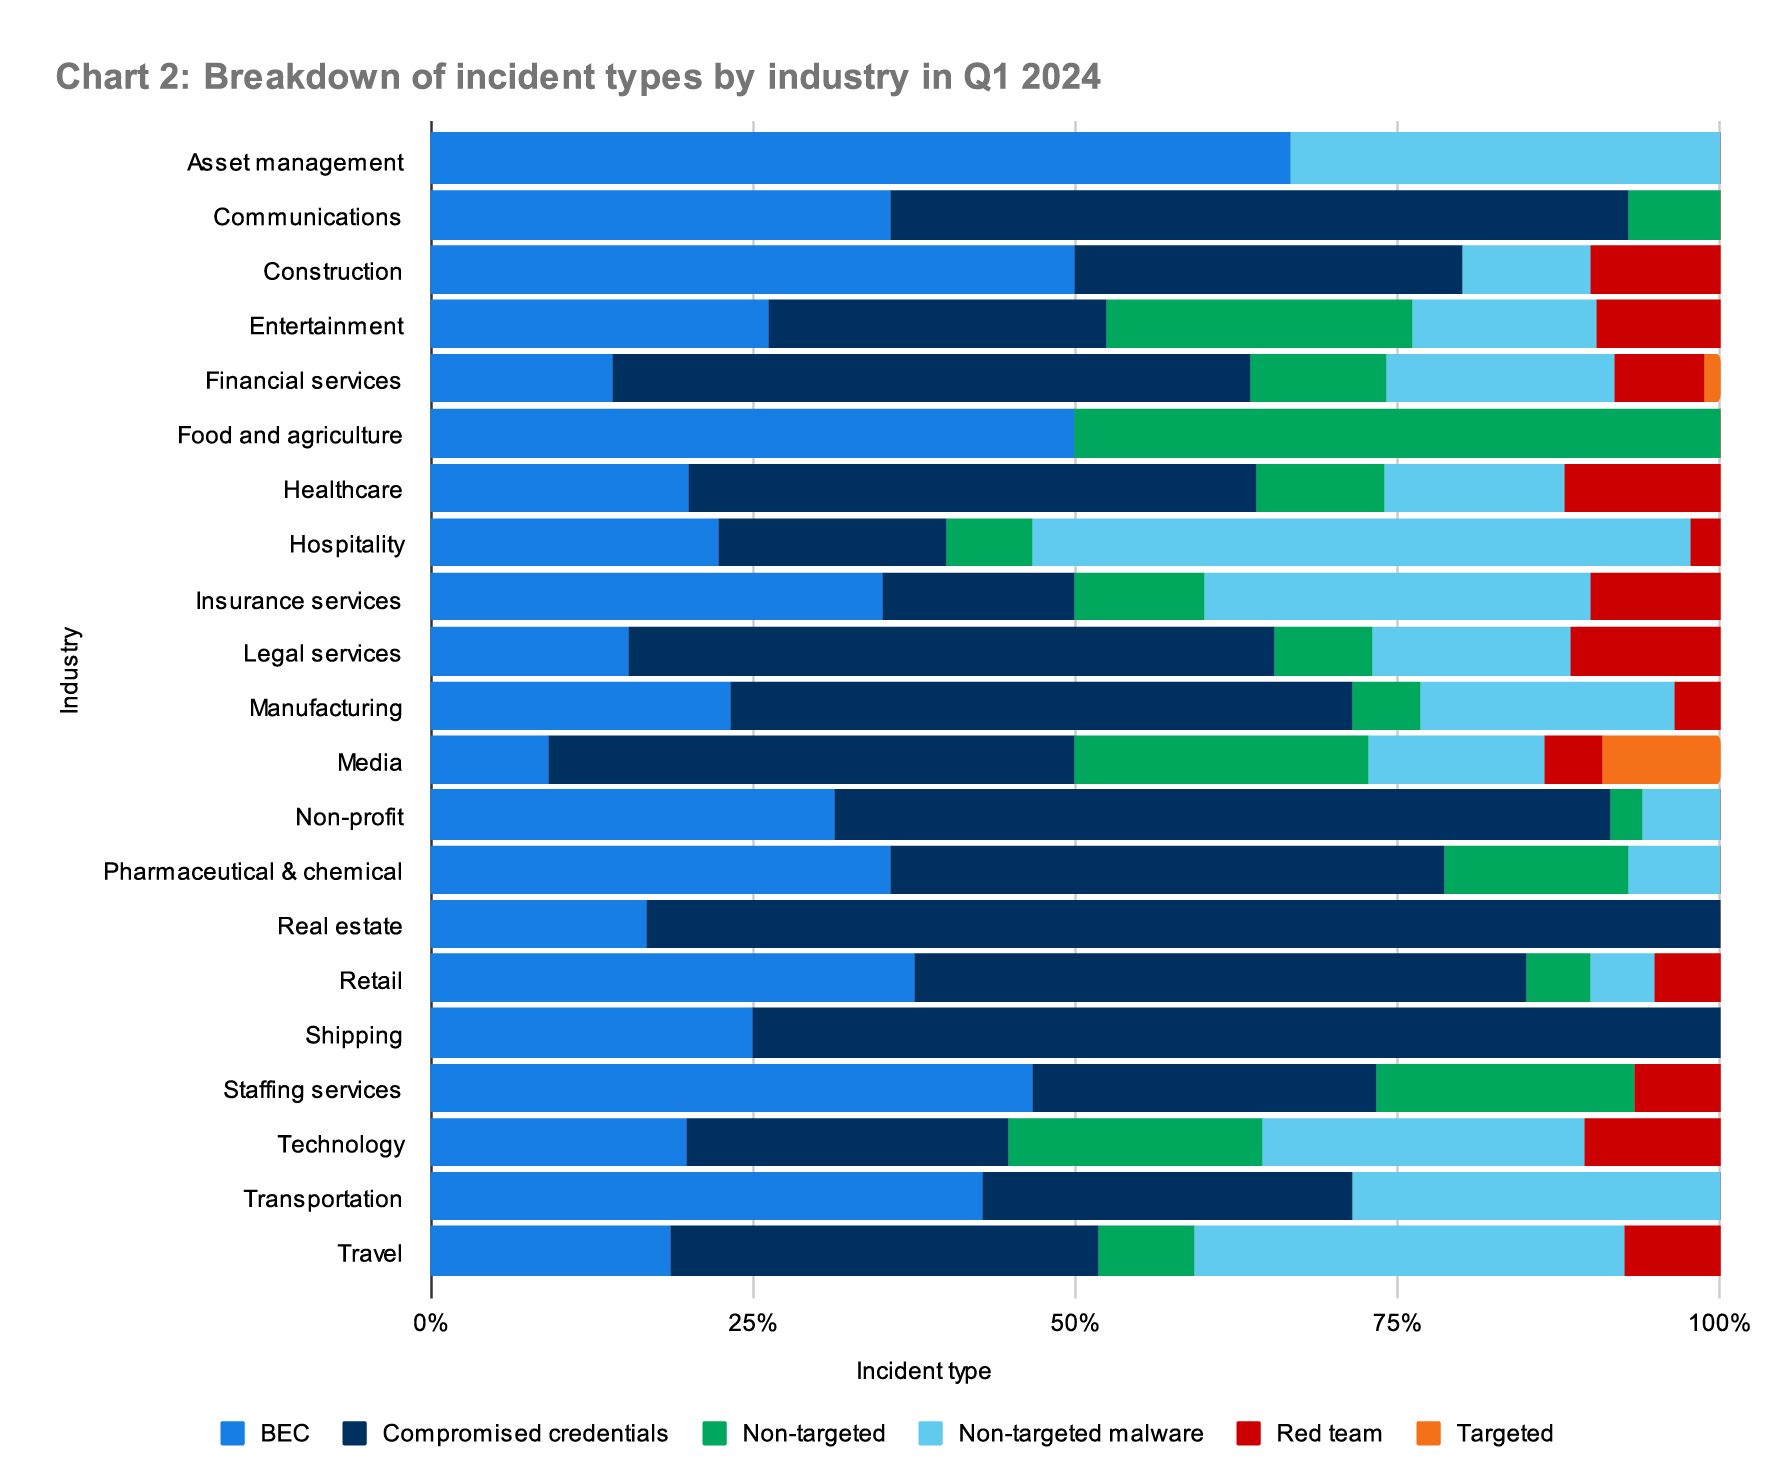
This quarter’s findings also demonstrate that identity compromise threats (and the actors behind them) don’t favor any particular industry. Attackers are opportunistic, and tend to target the vulnerable—regardless of industry. Chart 2 shows the percentage of incident types across industries represented by our customers. (Note: in this illustration, we exclude industries that lack a large enough sample size to be statistically relevant.)
And that’s just the tip of the iceberg. There’s a lot to unpack this quarter—this series continues with volume II: attackers and AI. If you have any questions or just want to chat, don’t hesitate to drop us a line.
Q1 QTR series quick links
Check out the other blogs in the series for more of our Q1 findings:


")
