
TL;DR
- This is part one of four of our Quarterly Threat Report blog series for Q1 2025
- Here are parts two, three, and four
- Part one covers the overall stats regarding incidents we investigated
About these reports
The trends in our QTR are based on incidents our security operations center (SOC) identified through investigations into alerts, email submissions, or threat hunting leads in the first quarter (Q1) of 2025. We analyzed incidents across our customer base, which includes organizations of all sizes, in many industries, and with differing security maturity levels. In the process, we identify patterns and attacker tendencies to help guide strategic decision-making and operational processes for your team.
Welcome to the Expel Quarterly Threat Report (QTR) for Q1 2025. Our QTRs summarize the attacks we’re seeing over the quarter and recommend ways you can protect your organization.
To start things off this quarter, we’re summarizing what was seen in the past three months. Then we’ll dive into major trends and noteworthy events in the rest of this blog series. This quarter, we’ve focused specifically on doing that deep dive on specific attack surface types to give you a new vantage point into our data. Let’s go!
Incidents encountered by the Expel SOC
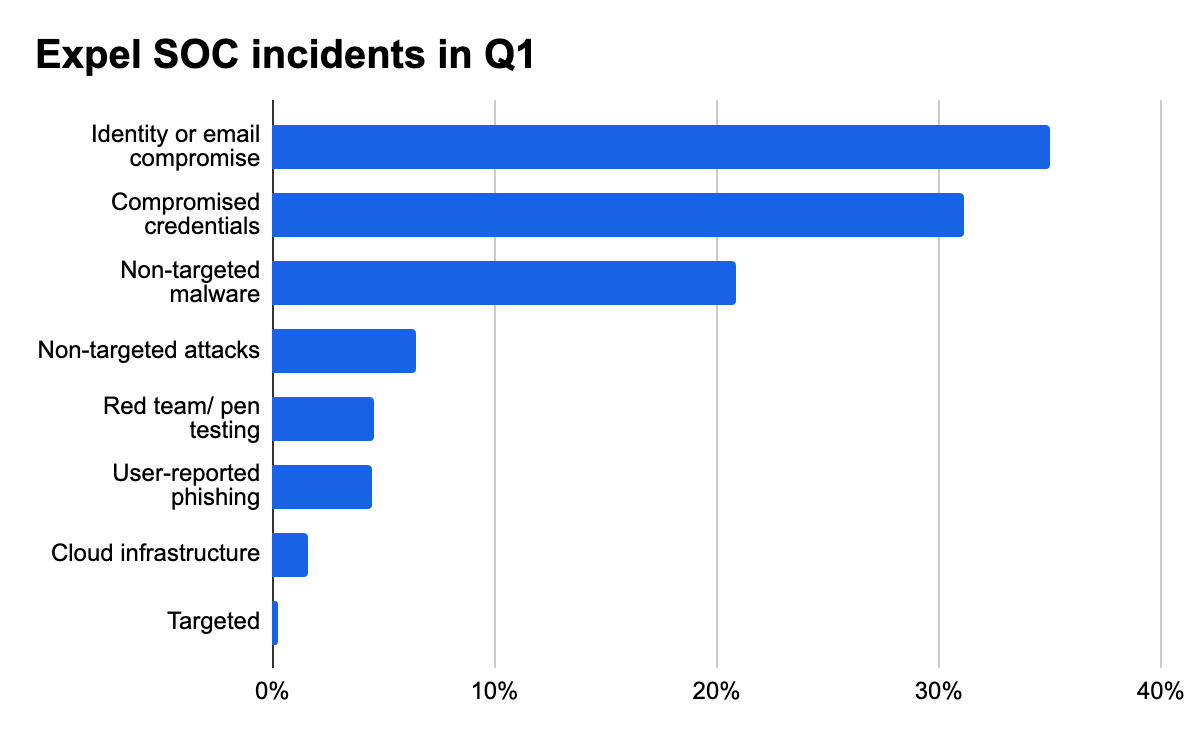
First off, let’s talk about what our SOC has been seeing in the last quarter.
From January to March 2025:
- 66.2% of all incidents we investigated were identity-based attacks
- 20.9% of incidents we observed were non-targeted malware attacks
- 61.9% of these were infostealer malware deployments
- 4.6% of incidents accounted for authorized pen tests, or red and purple team exercises
- 80.3% of these instances focused on endpoint, and the remaining 19.6% targeted cloud infrastructure resources
- 1.6% of total incident volume targeted cloud infrastructure directly (think AWS, GCP, Azure, Oracle Cloud Infrastructure, and Kubernetes)
- Misconfigurations and accidental public-access key exposure were the most common issues here
Identity-based attacks are consistently the predominant threat our SOC sees. Identity-based attacks accounted for 66.2% of all incidents our SOC identified. This high rate of 65–70% has been consistent for the past year.
In the context of this report, we define identity threats as attacker attempts to gain access to a user’s identity to perpetuate fraud. With access to accounts, attackers may attempt to access emails or business applications.
Non-targeted cyber attacks leveraging malware accounted for 20.9% of the incidents our SOC observed in Q1. Of those incidents, 61.9% were deployments of infostealing malware (malware that prioritizes stealing credentials to be resold to attackers).
The click-fix technique continues to be one of the major drivers of this activity. This technique involves tricking end-users into executing code. This was seen in 51% of all malware incidents and 78% of all infostealer malware incidents.
A new perspective on attack surfaces
This quarter, we’re going to organize our data a bit differently. We’ve split the attack surfaces we monitor into a few simple categories to help us better understand how threats target each unique front.
The categories are:
- Cloud-based services
- Endpoints
- Cloud infrastructure
When comparing them, they equate to three very different defensive fronts, requiring different postures to address them. We’ll give an overview of each of these in this post, followed by a full analysis in parts two through four of this QTR.
Cloud-based services
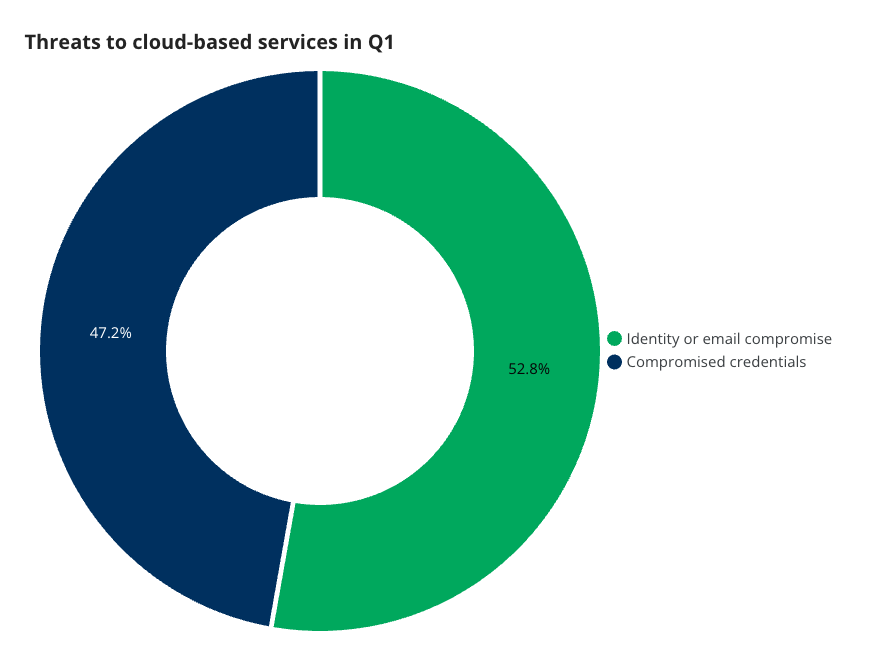
The first front we see is cloud-based services. These are apps and services operated and maintained by third parties and hosted on their infrastructure. Think of everyday business tools such as communication apps, office suites, design tools, and so on.
There are two main threat types seen in cloud service incidents. Identity and email compromise incidents occur when an attacker has managed to get ahold of a user’s login credentials for apps like their email or identity verification. Compromised credentials covers cases where an attacker has obtained credentials, but has been prevented from accessing the account thanks to various controls.
Endpoints
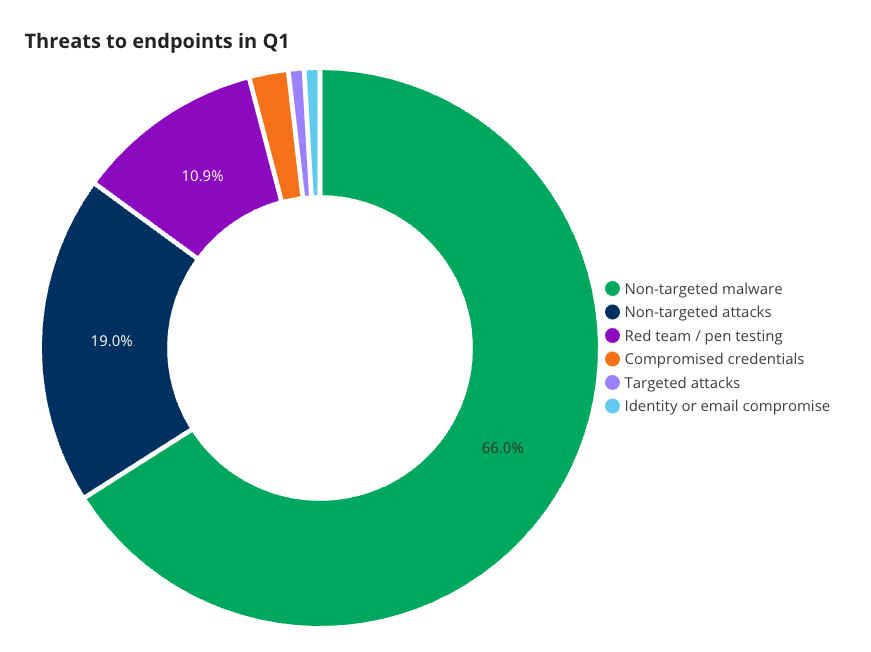
The endpoint activity category is generally incidents raised by alerts from EDR and XDR applications, such as an end user’s download of malware or an attacker’s hands-on attempt to compromise a network. The category gives us a good idea about the types of attacks bad actors are carrying out against various devices within the network.
Two-thirds (66%) of the threats seen can be categorized as non-targeted malware. The next 19% were non-targeted attacks, followed by red team and penetration testing activity at 10.9%. These three categories combined represent 95.9% of endpoint incidents.
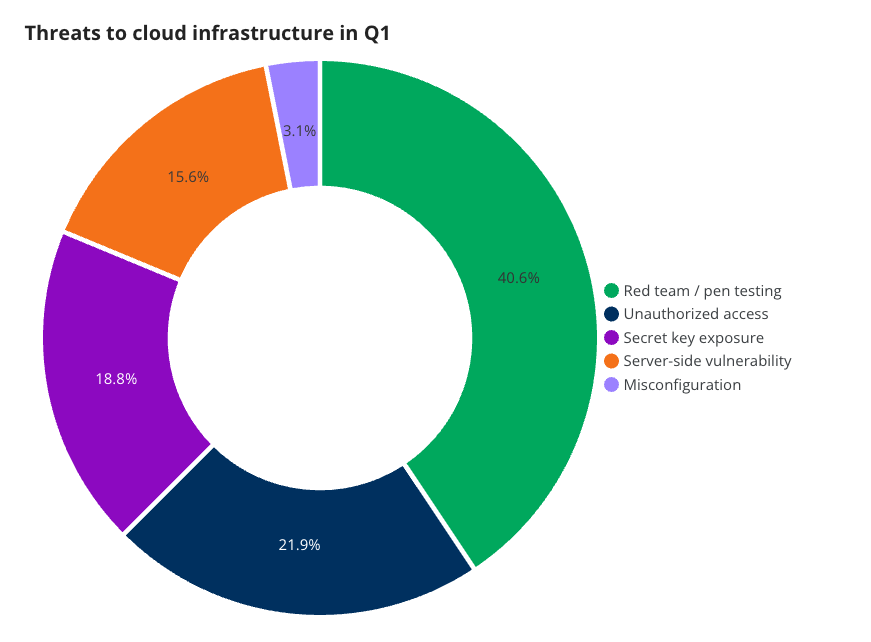
Cloud infrastructure
Cloud infrastructure experiences its own unique threats. This category contains more red team activity—as opposed to attacker activity—than any other specific category. This is due to a relatively low amount of cyberattacks against this attack surface and proactive auditing by security teams. Attacker-driven activities were the result of secret key exposure, server side vulnerabilities, and misconfigurations.
A tale of attack surfaces
The key takeaway here? Attack surfaces are distinct, and so are attacker techniques for each. With cloud-based services, attackers either use previously stolen credentials or phishing campaigns to gain access. For endpoint, attackers are usually more traditional in their tactics, and focus on malware, compromising public-facing resources, and utilizing removable media (like USB drives) to compromise devices. Meanwhile, cloud infrastructure—a relatively new attack surface—requires continuous learning from both attackers and defenders to know how to compromise and protect.
These diverse attack surfaces require security teams to draft completely different defensive plans for each front, which is why it’s critical to analyze incident data by more than just volume. Later in the series, we’ll dive into the numbers behind each attack surface during the quarter, so be sure to stay tuned!
Now that we’ve covered volume and attack surfaces, let’s break it down by industry.
Industry incident types
Because of the variety of industries Expel protects, we chose to highlight the top ten industries with the most incidents each quarter to shed light on activity. This gives us a broad view of industry trends, and can help identify what’s most active in your industry, letting you plan accordingly.
This quarter, those top ten industries from most to least incidents were:
- Financial services
- Healthcare
- Manufacturing
- Entertainment
- Technology
- Retail
- Education
- Pharmaceutical & chemical
- Hospitality
- Legal services
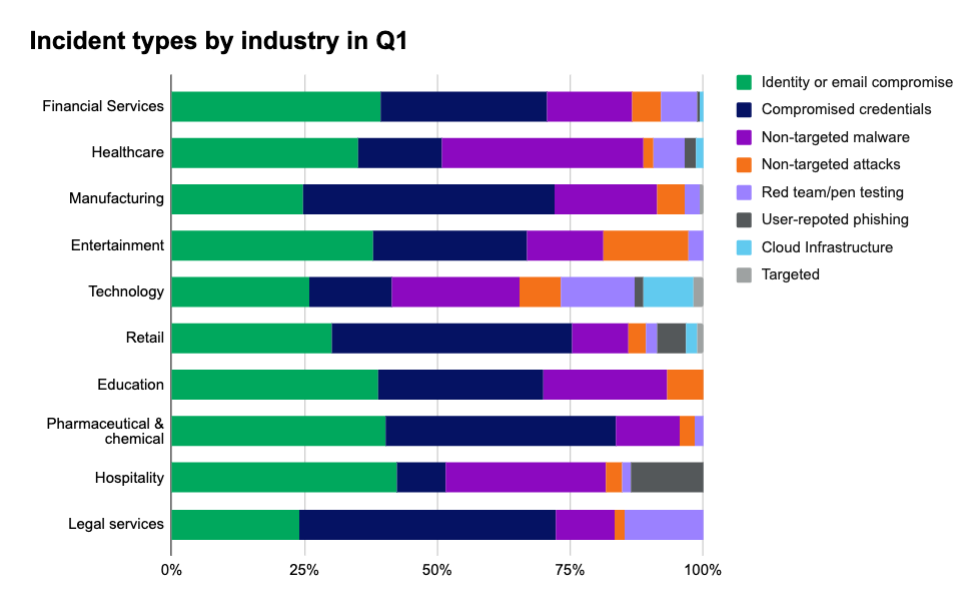
Based on our industry knowledge and public intel, the vast majority of incidents this quarter stemmed from broad attacks—that is, these attacks weren’t targeting a specific organization or industry. While we observed some attacks specifically targeting some organizations, these were rare—only making up 0.2% of the total incidents we saw.
Here’s a few more industry-specific takeaways from Q1 2025:
- Financial services makes up 13% of our customer base, but accounts for 16.7% of all incidents.
- Healthcare industry companies saw the highest rate of non-targeted malware incidents (37.7% of incidents in the industry).
- Companies in technology, followed by financial services, have the most cloud infrastructure implemented, but of the two sectors, companies in technology see a higher rate of incidents.
That’s it for our Q1 2025 summary. Next up, we’re diving into trends against cloud-based services. And if you have any questions or just want to chat about anything you see here, don’t hesitate to drop us a line.
")

")
