If you work for an organization that has a web presence (and let’s be real, they almost all do) and that presence is perfectly coded, has zero vulnerabilities nor any functions that could be misused … then you can stop reading.
For everyone else, know that there’s a real chance of your website being compromised at some point — leading to things like website defacement, website functionality modification or a broader compromise of the network. The common theme for these sorts of attacks are web vulnerabilities that lead to the upload of web shells, giving an attacker a foothold on the underlying server. In this blog post, I’ll talk about what a web shell is, some of the typical ways of detecting them and the (vastly improved) detection method I discovered.
What’s a web shell?
A web shell is a web page or web resource that abuses certain functions in web languages (like PHP, JavaScript, etc.) that give it backdoor-like capabilities to the underlying web server. Capabilities typically include things like file upload, file download, and arbitrary command execution. Web shells usually crop up after a threat actor exploited a website vulnerability and gives the attacker an initial foothold onto a network through the web server.
Typical methods of detecting web shells
Detection of web shells traditionally comes in two forms, both with downsides.
The first detection method involves detection on the endpoint by file name, file hash, or file content. Unfortunately this is often CPU intensive which means business operations teams may not allow you to do it on production systems.
The second method is passive and effective but it’s a pain to set up and manage. It involves mirroring web traffic to a network traffic monitoring device that has built-in detections or supports custom Snort or Suricata rules. You’ll also need to upload your web server SSL private keys to the network appliance(s) for SSL decryption or you won’t be able to inspect encrypted web traffic. I don’t know about you, but that’s not a mess that I’d want to manage or deal with.
How Expel uses Signal Sciences WAF to detect web shells
One of the commitments we’ve made to our customers since Expel was founded is to support and integrate with the security technologies that our customers already use or plan to buy. Several of our customers use the Signal Sciences Web Application Firewall (WAF), so we created an easy way to integrate those security signals into Expel Workbench.
As we were developing our integration, I discovered that the Signal Science WAF has a great capability to detect web shells thanks to a complete application layer visibility into web traffic with a user-friendly rules engine bolted on top. That’s right — a rules engine that allows you to key off of web content such as HTTP methods, any header keys and values (even custom headers), query parameter keys and values, post body keys and values, domain, URI, or any combination of the preceding items. This visibility and rules engine allows us to augment customers’ Signal Sciences WAF deployments with granular rules that detect network traffic to popular web shell variants with a high fidelity (meaning it’ll only trigger on the traffic we’re looking for).
I’ll pull back the curtain and show you how Expel develops web shell detection rules for its customers so you can try the process yourself with your own Signal Science WAF deployment.
How Expel develops web shell detection rules using the Signal Sciences rules engine
Here’s a high-level overview of the web shell detection rule development process:
- Stand up a web server running whatever web language you want to develop rules for and install the Signal Science WAF agent. I started with an Ubuntu server running Apache and PHP.
- Find some web shells. Thankfully that’s not very hard.
- Copy web shells you want to write rules for to a directory the web service is serving resources from.
- Load up a packet capturing tool or my preferred tool, Chrome browser’s built-in developer’s console.
- Access the web shell and use its various functions, looking for unique indicators in the HTTP requests.
- Create the rule to detect the web shell in the Signal Science WAF rule editor and hook it up to a signal that would generate an alert.
- Test out your new rule by interacting with the web shell again, verifying that all the actions you intended to detect are being detected.
Now I’ll walk through the specifics of creating a rule for the WSO web shell version 4.0.5 (MD5: b4d3b9dbdd36cac0eba7a598877b6da1) starting at step 5 of the process I described above.
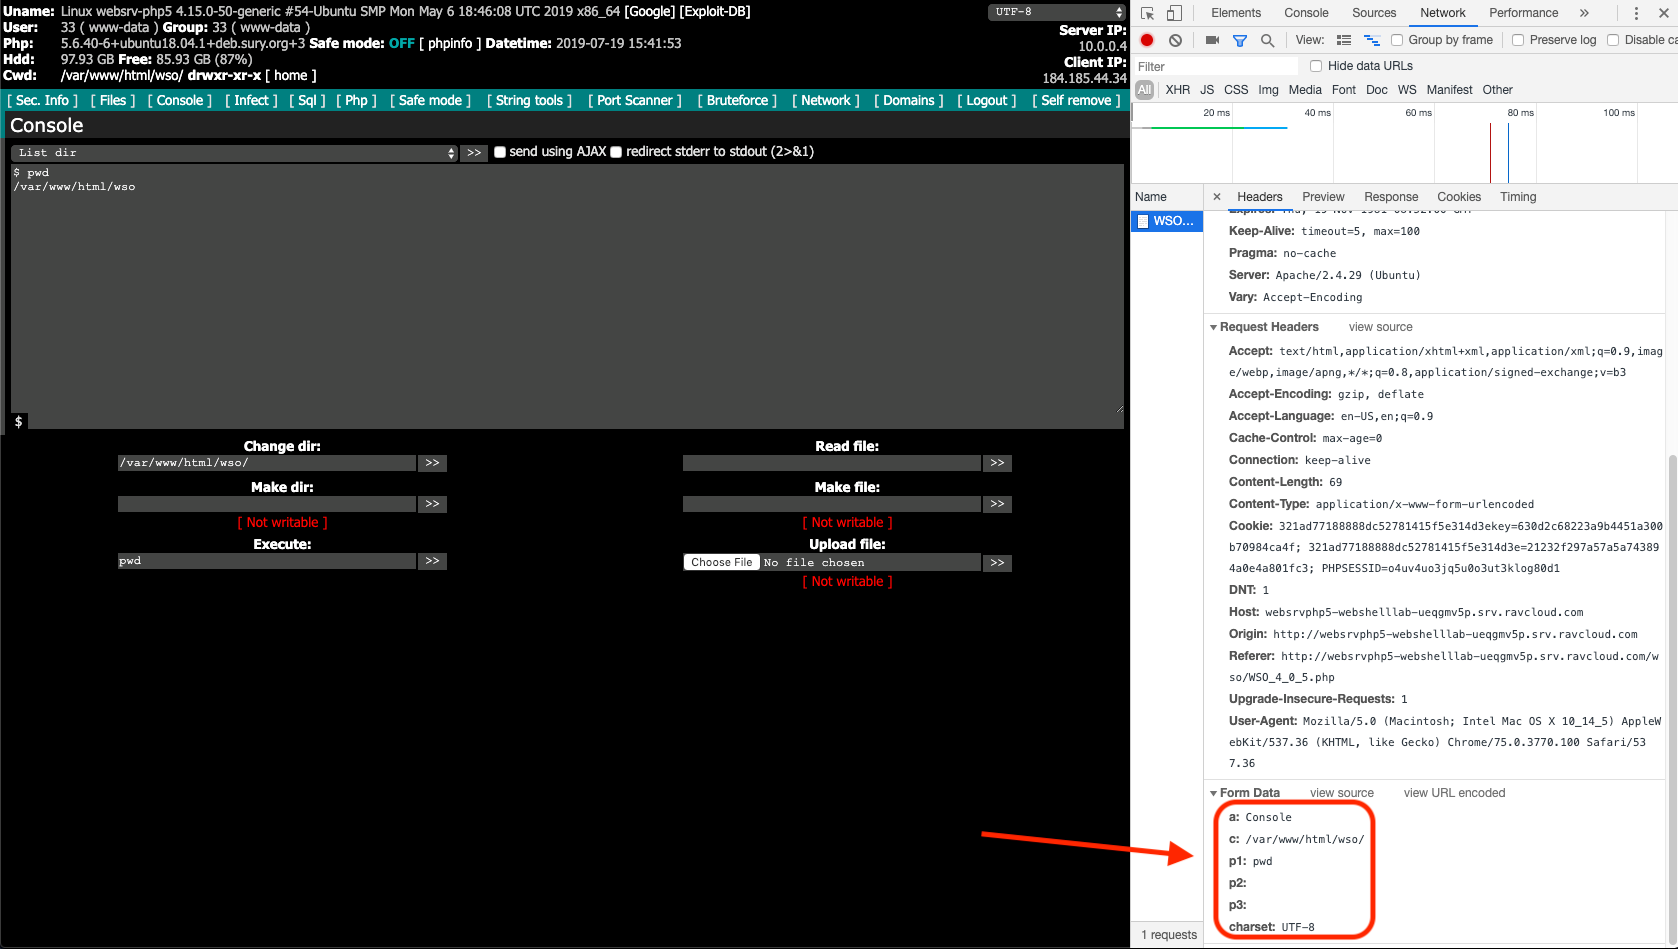
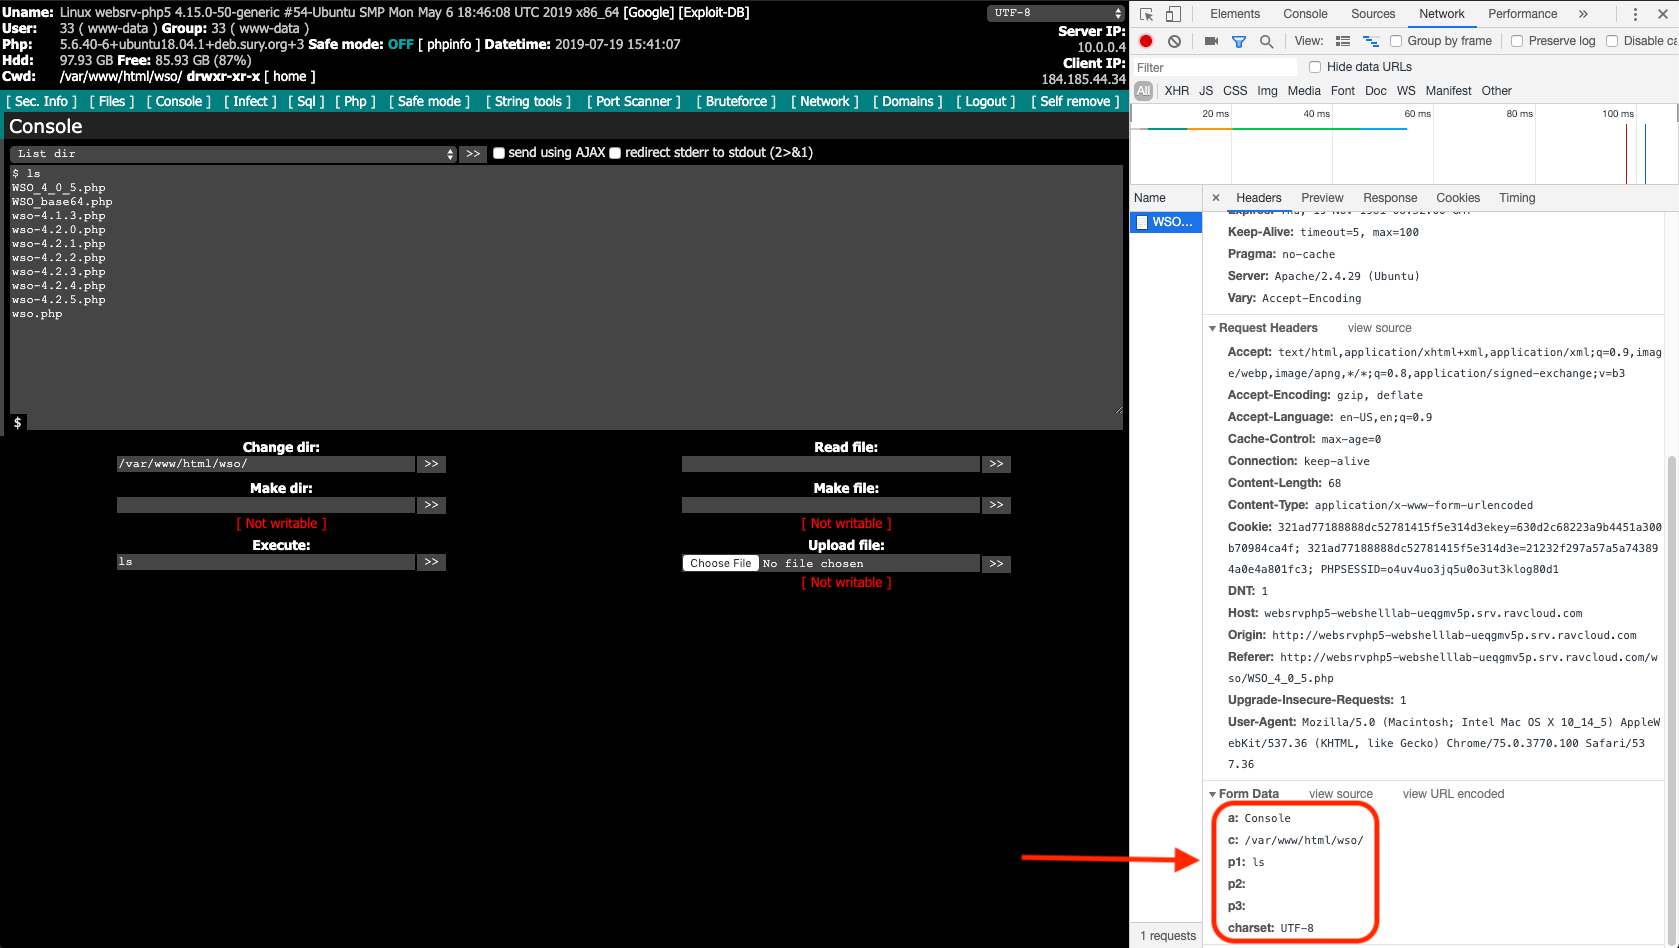
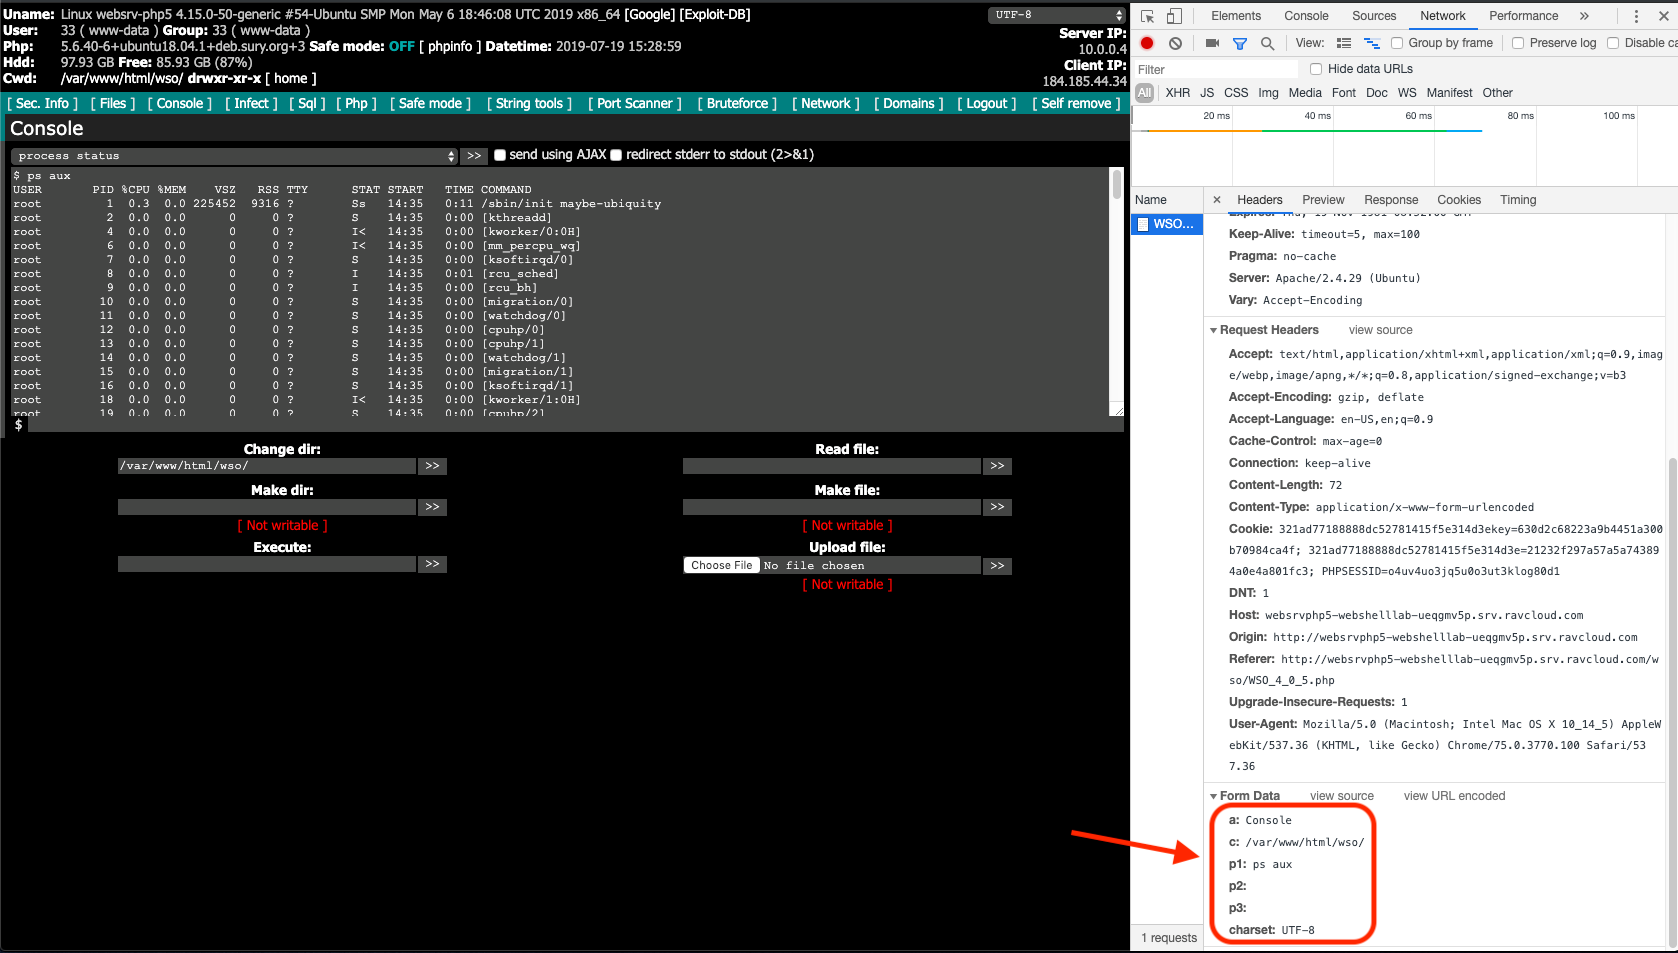
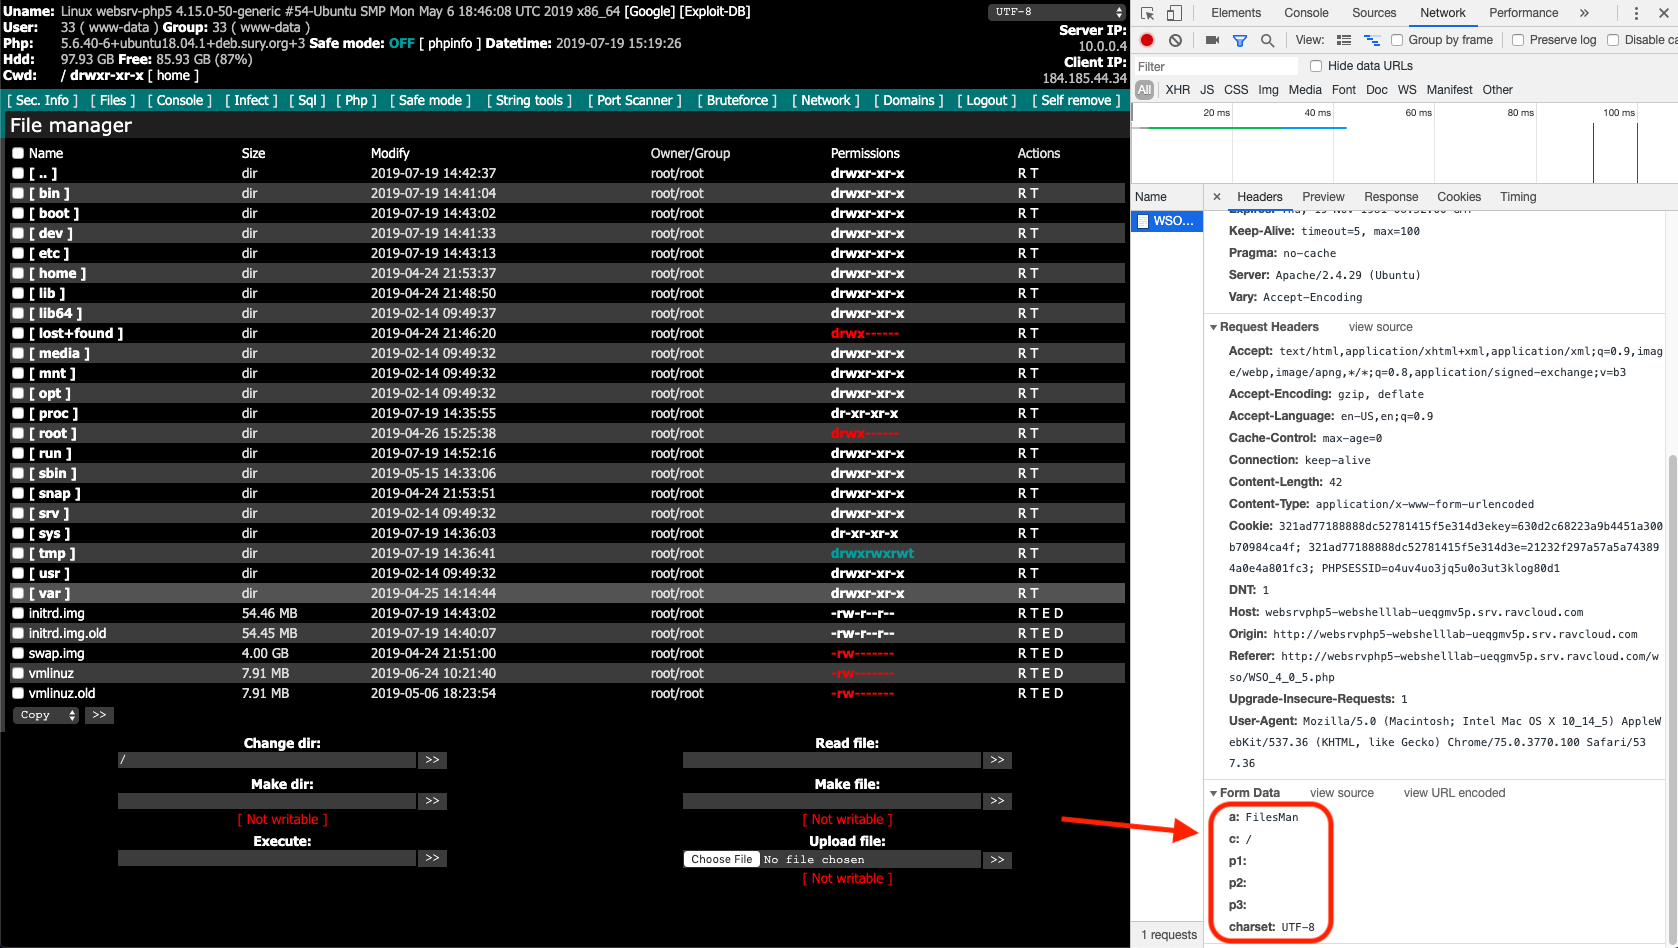
The following screenshot series will show you how to take different actions through the WSO web shell while having Chrome’s developer console open. You’ll see me:
- Executing “pwd” to return my present working directory.
- Executing “ls” to return a directory listing of my current working directory.
- Using the built in function “Process status” which is a WSO execution wrapper around the shell command “ps aux” and
- Navigating to the root of the server’s file system.
In each screenshot below, I added red boxes around the post-body parameters my browser sent to the web shell. Take a peek:
Execution of “pwd” to return the present working directory.
Execution of “ls” to return a list of content in the current working directory.
Use of “Process status” which is a WSO execution wrapper around the shell command “ps aux”
Navigation to the root of the server’s file system.
Each request always had the parameters “a”, “c”, “p1”, “p2”, “p3” and “charset.” It turns out that all actions taken while using this web shell will have those parameters. If you review other versions of the WSO web shell this’ll also be true. So if you want to generically detect WSO web shell use regardless of version, all you need to do is look for all those parameters being present in a request.
Before you write a rule, you need to prepare a few things in the Signal Sciences WAF:
- Create a “site signal” on each site where you want your rules monitoring that your rules will point to. In my example, I called the signal “expel-alert”.
- Create a “site alert” that takes in the new signal and set the threshold to one request in one minute. This is the lowest threshold that you can set. Since your WSO web shell will be high fidelity, you want an alert generated if that threshold is ever met.
Signal Sciences WAF has a powerful feature called “advanced rules” which Signal Sciences reps can turn on for you. There’s an additional cost, but the feature greatly expands the WAF’s capability. For each Expel customer that has a Signal Science WAF, we deploy an advanced rule. This rule turns on verbose logging that records post-body contents and query parameters. We only enable verbose logging on expel-alert signals. This gives us complete visibility into commands sent to a web shell so we can investigate alerts.
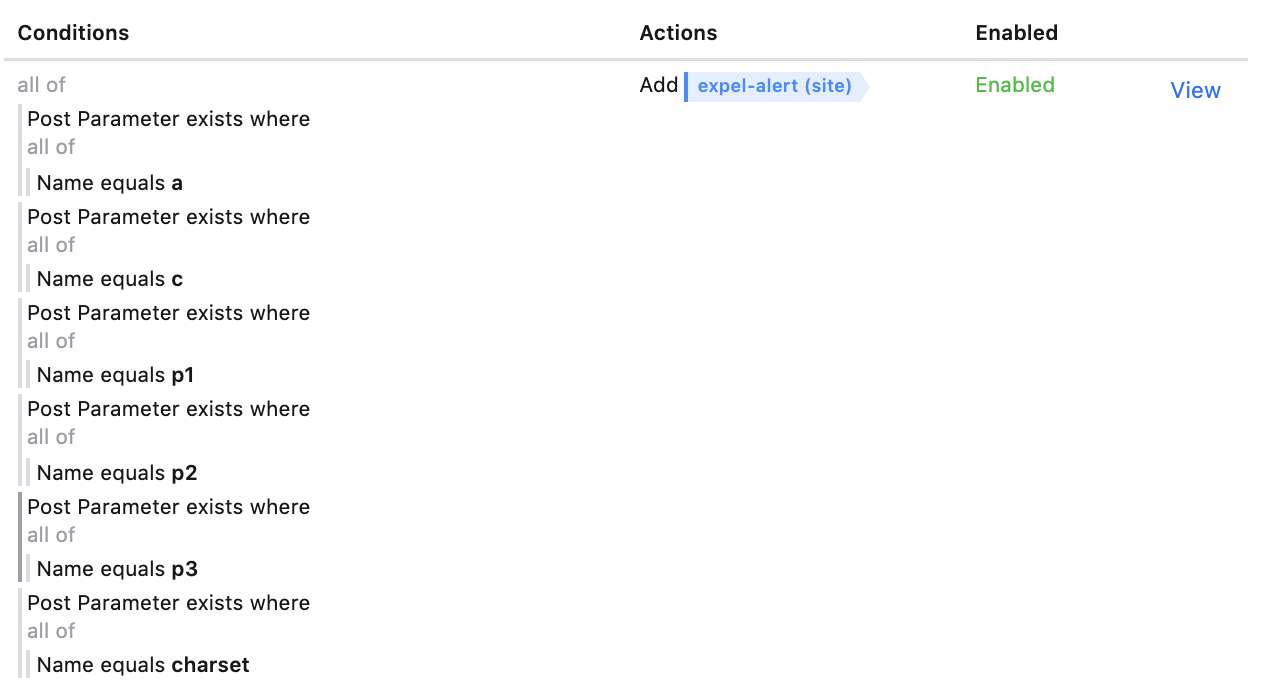
Now onto the meat of the rule. In the “site rule” editor, you’ll want to chain five “Post Parameter exists where name equals <string>” where “<string>” are the values “a”, “c”, “p1”, “p2”, “p3”, and “charset”. Set the rule action to add the signal “expel-alert”. Take a look at the final rule configuration:
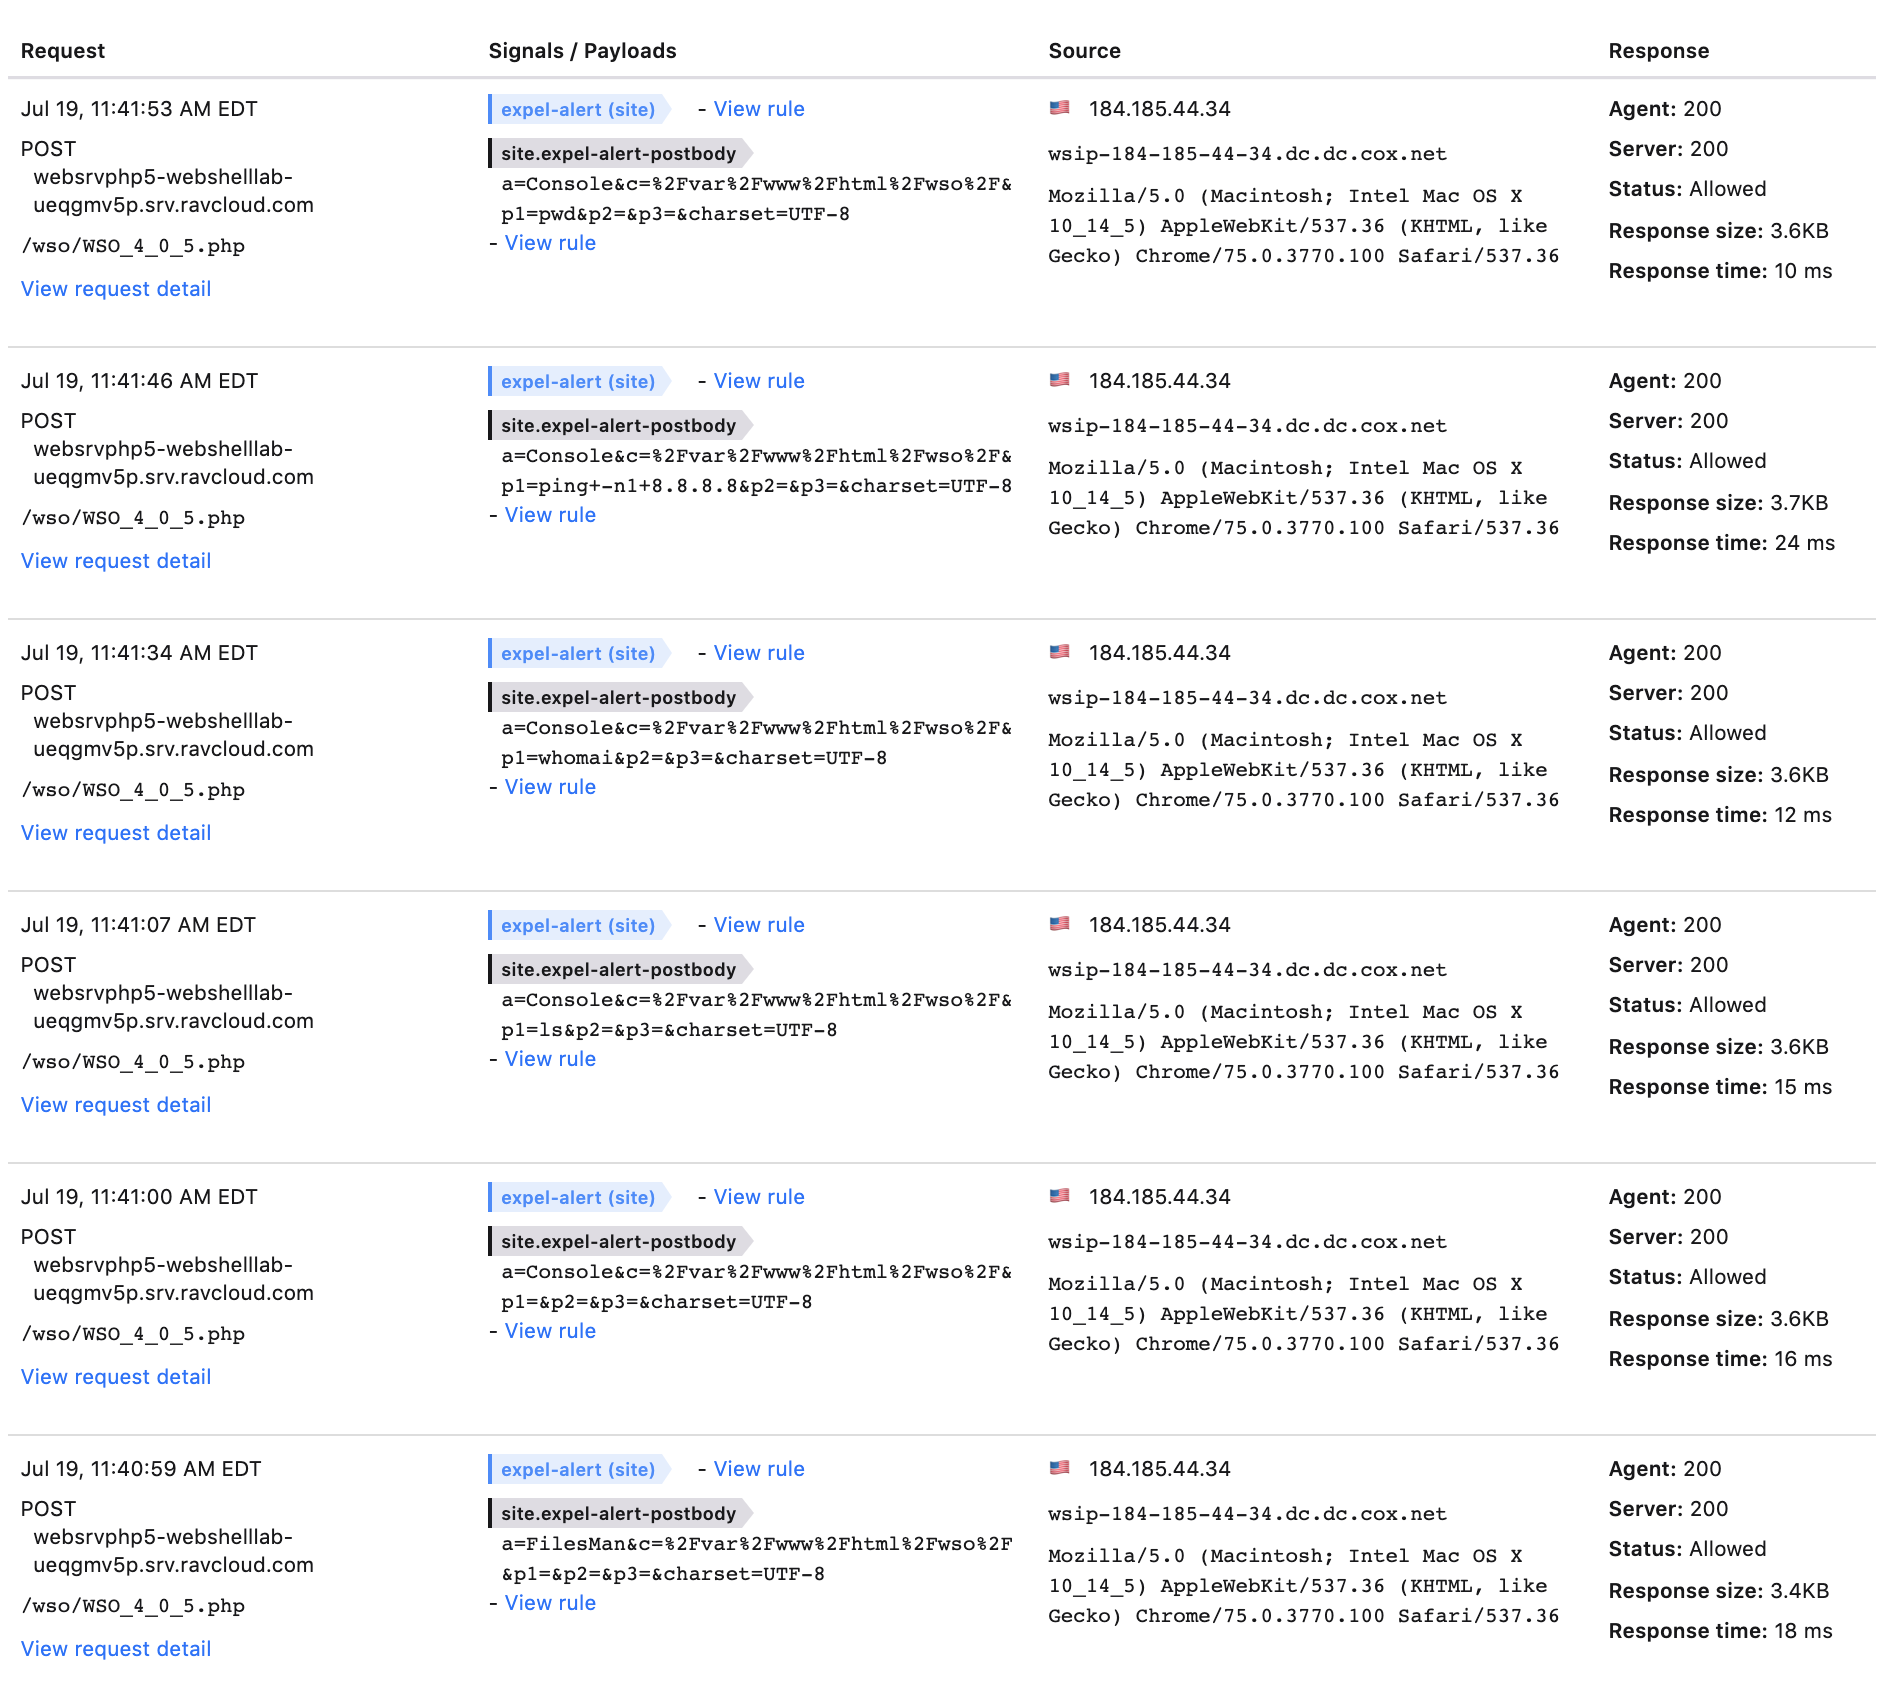
The final step is to test the efficacy of your rule by using the web shell some more to see what gets tagged. Take a look at the screen shot below — every request we made to the web shell was tagged with “expel-alert” and has its post-body contents logged. Success!
Bonus: Free web shell detection rules
As a reward for making it through this blog post, I’ve got a prize for you: ten web shell detection rules that you can upload right into your Signal Science WAF. They’ll detect WSO, r57, c99, c99 madnet, PAS, China Chopper, B374k, reGeorg and reDuh web shells. There’s also a generic rule to detect some common commands that could be pushed to web shells we don’t have explicit rules for.
To download these web shell detection rules, submit your info below and we’ll send it over in an email.


