

Expel’s quarterly threat intelligence report delivers real-world incident data directly from our SOC, updated every quarter so you always have a current view of the threat landscape. Each edition covers the top attack surfaces—identity, endpoint, and cloud infrastructure—with breakdowns by incident type, attacker technique, and distribution method. Unlike a static annual report, this page is a living resource: new data is added each quarter, and older data stays, so you can track how attacker behavior evolves over time.
Q2 2026 incident summary
Based on our SOC’s data from Q2 2026, Expel saw:
- 68.1% of incidents targeted the identity attack surface
- 29.8% of incidents targeted the endpoint attack surface
- 2.1% of incidents targeted the cloud infrastructure attack surface
In Q2 2026, we saw a higher balance of identity-related incidents, causing identity to make up 69.9% of all incidents we observed. This pushed the metric for endpoint threats down to 27.9%. Microsoft Teams phishing continues to be a major threat: This tactic isn’t new, but it’s one that we are seeing daily across our customers.

The latest data
Incident overview
Authors: Aaron Walton & Scout Scholes | Last updated July 2026
Compared to last quarter, Expel’s SOC saw the following changes in Q2 2026:
- Identity-related incidents increased from Q1 to 68.1%
- Endpoint-related incidents decreased from Q1 to 29.8%
- Cloud infrastructure-related incidents saw little change quarter-over-quarter
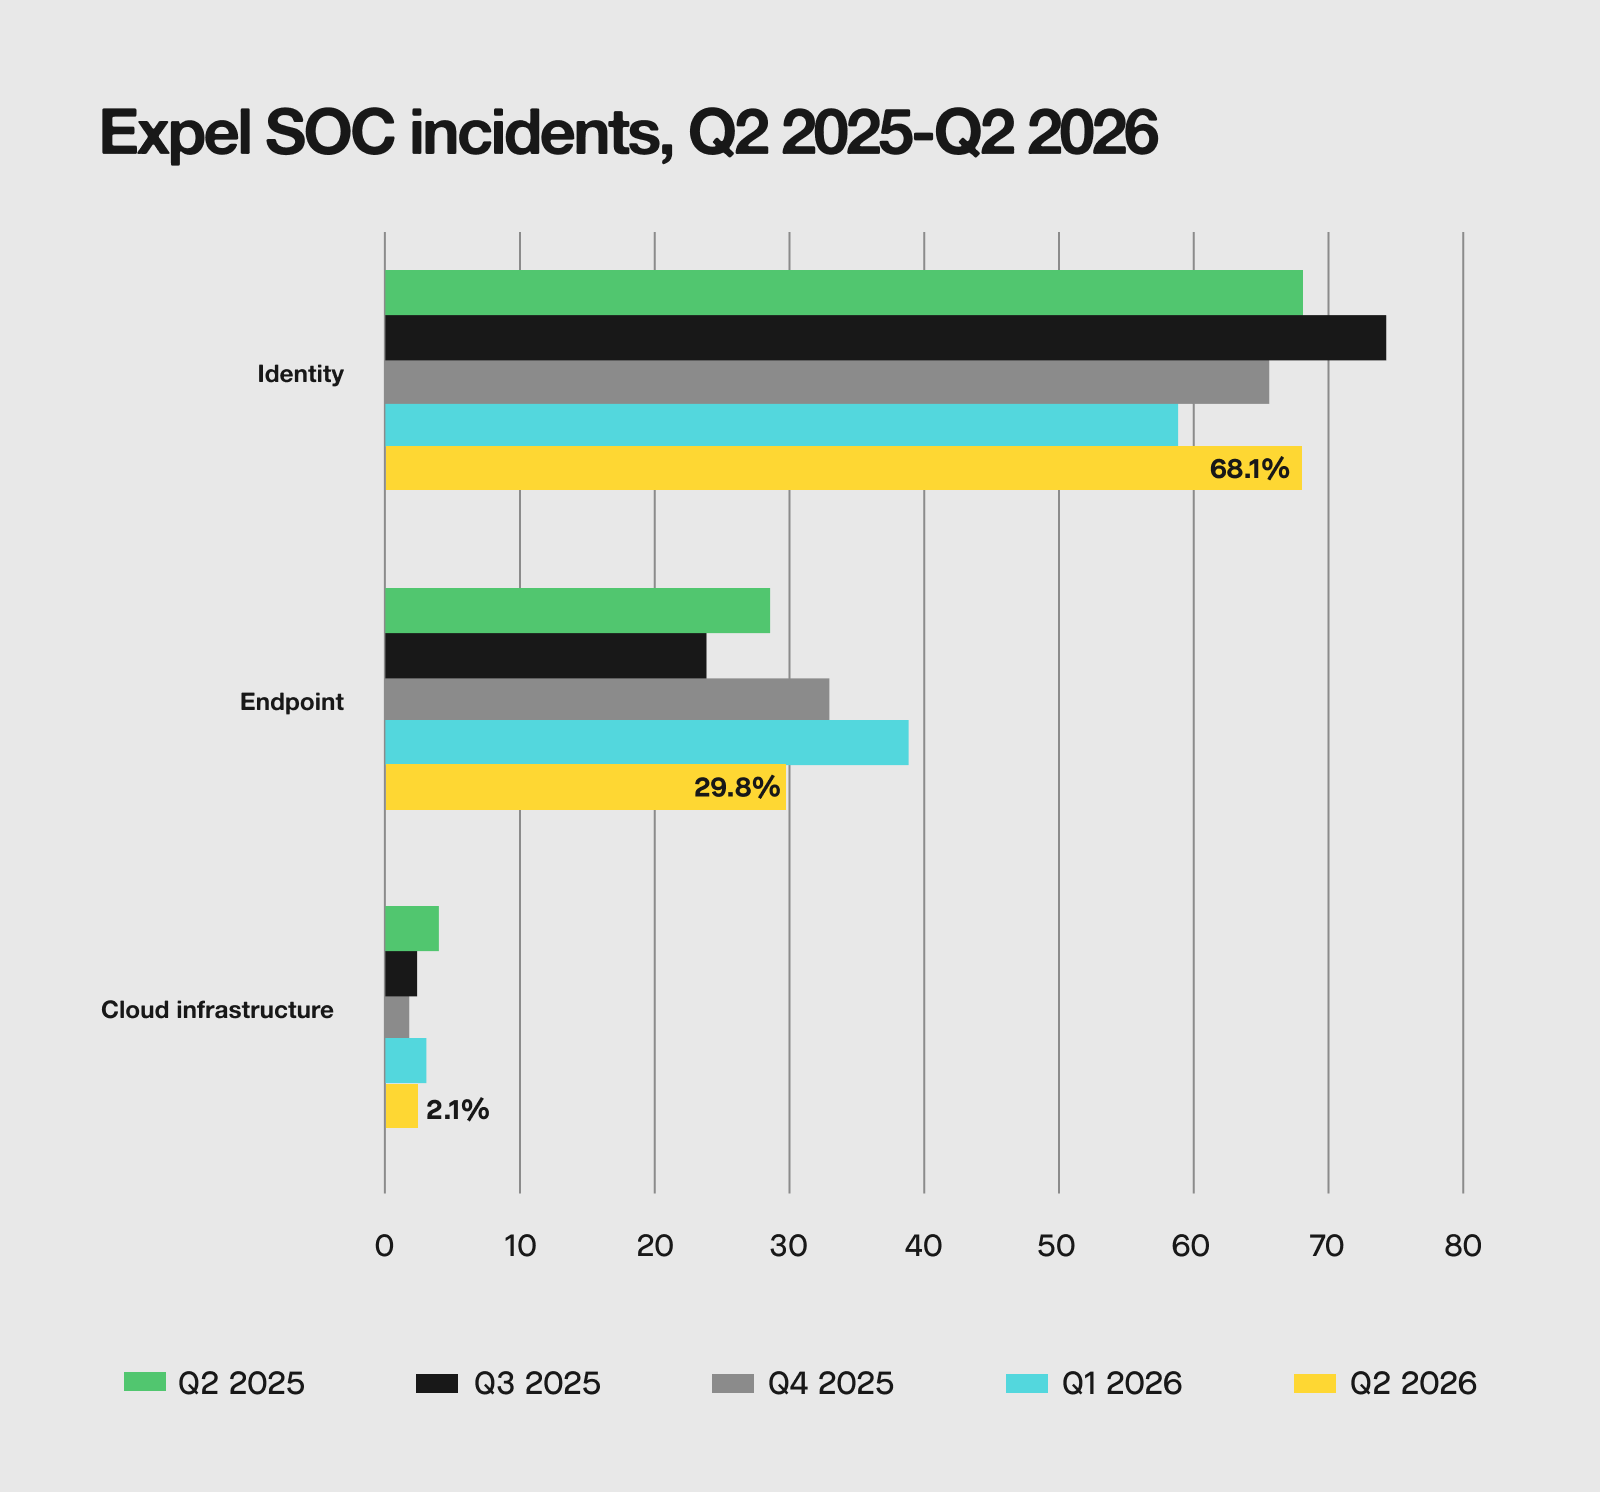
Identity incidents remain the top attack surface yet again in Q2, with an increase from last quarter (58.7%) to 68.1%. To account for that increase, endpoint incidents saw a proportional dip from last quarter, down to 29.8% of incidents. After seeing identity slowly decrease and endpoint slowly increase in the past few quarters, they’ve resumed old patterns in Q2.

IDENTITY
How is credential exploitation trending for Q2 2026?
Based on Expel’s SOC data, credential exploitation, or identity attacks, trended in the following patterns for Q2 2026:
- 51.3% of identity incidents in Q2 were access denied
- 40.4% were access granted, meaning attackers gained access but no malicious activity was detected
- 8.3% were accessed granted and malicious activity detected
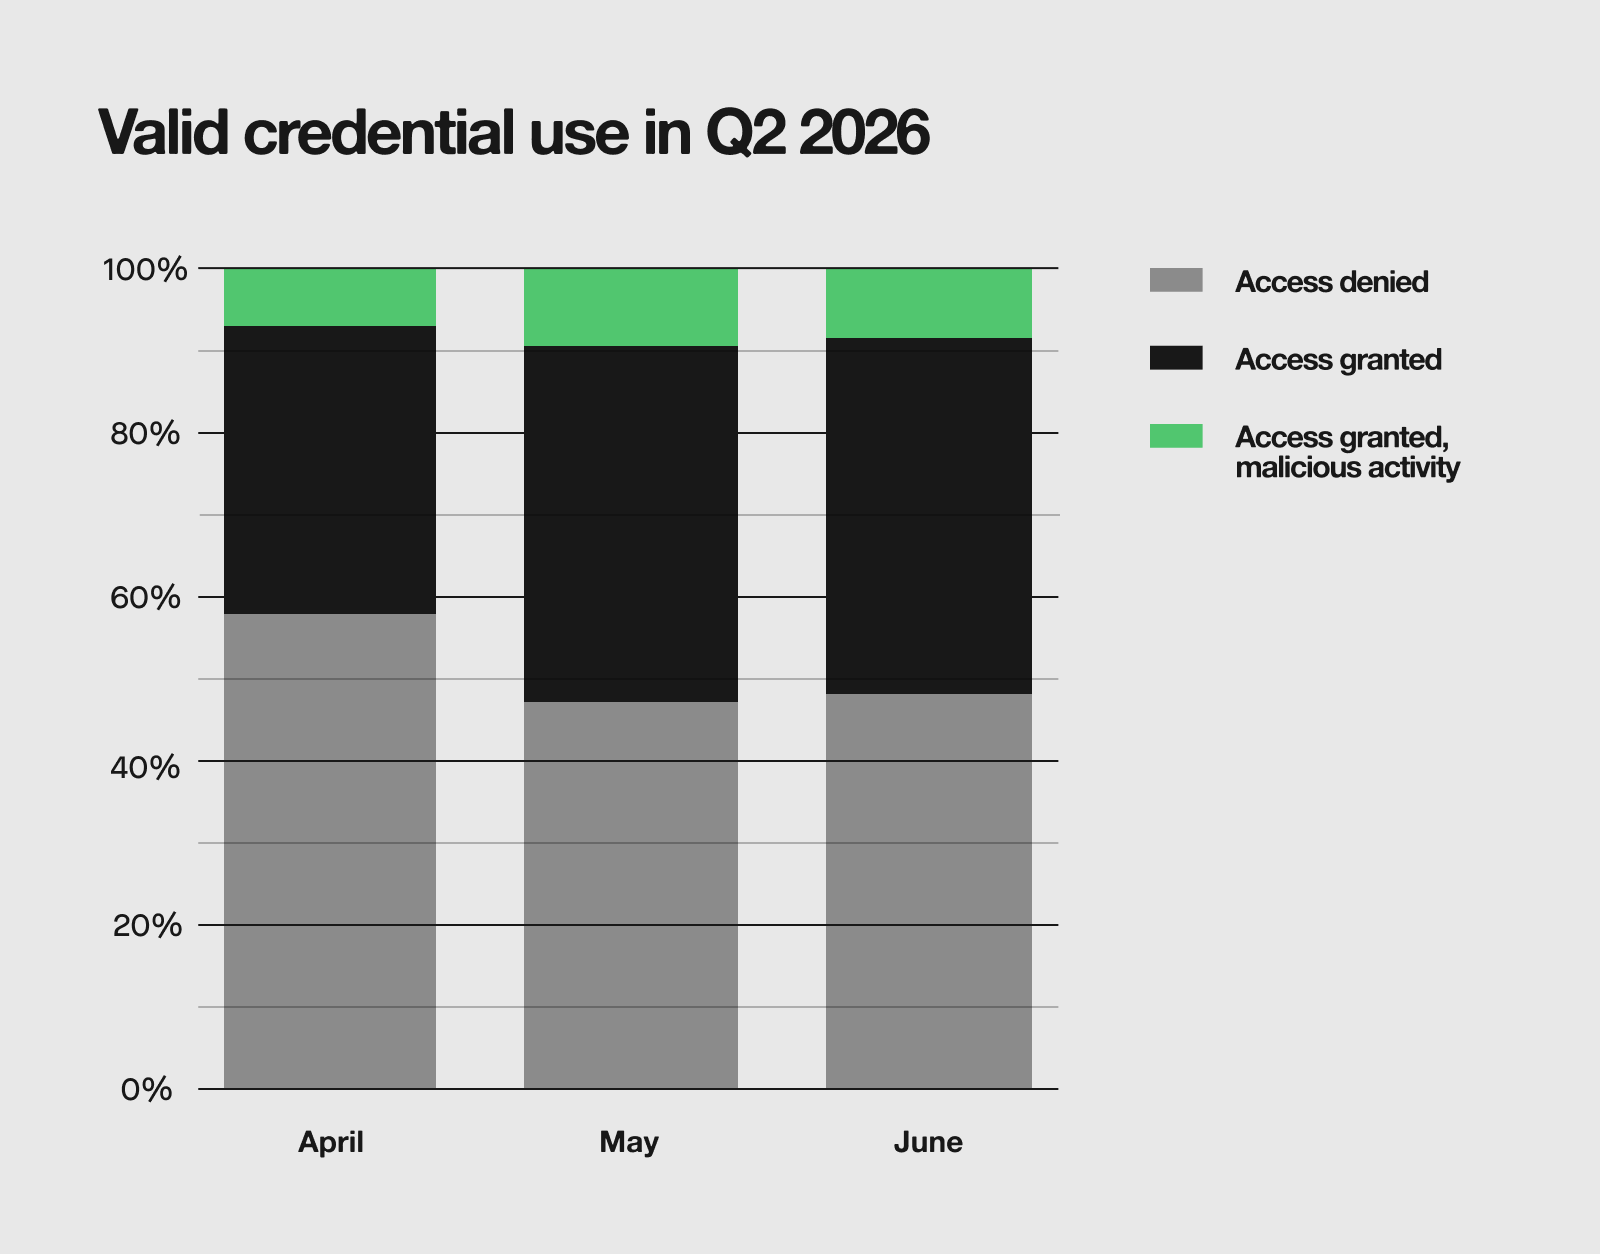
Two of the three months in Q2 2026 saw a concerning shift: the percentage of incidents where attackers were able to access accounts (access was granted) was over 50% in May and June, including an increase in malicious activity month-over-month.
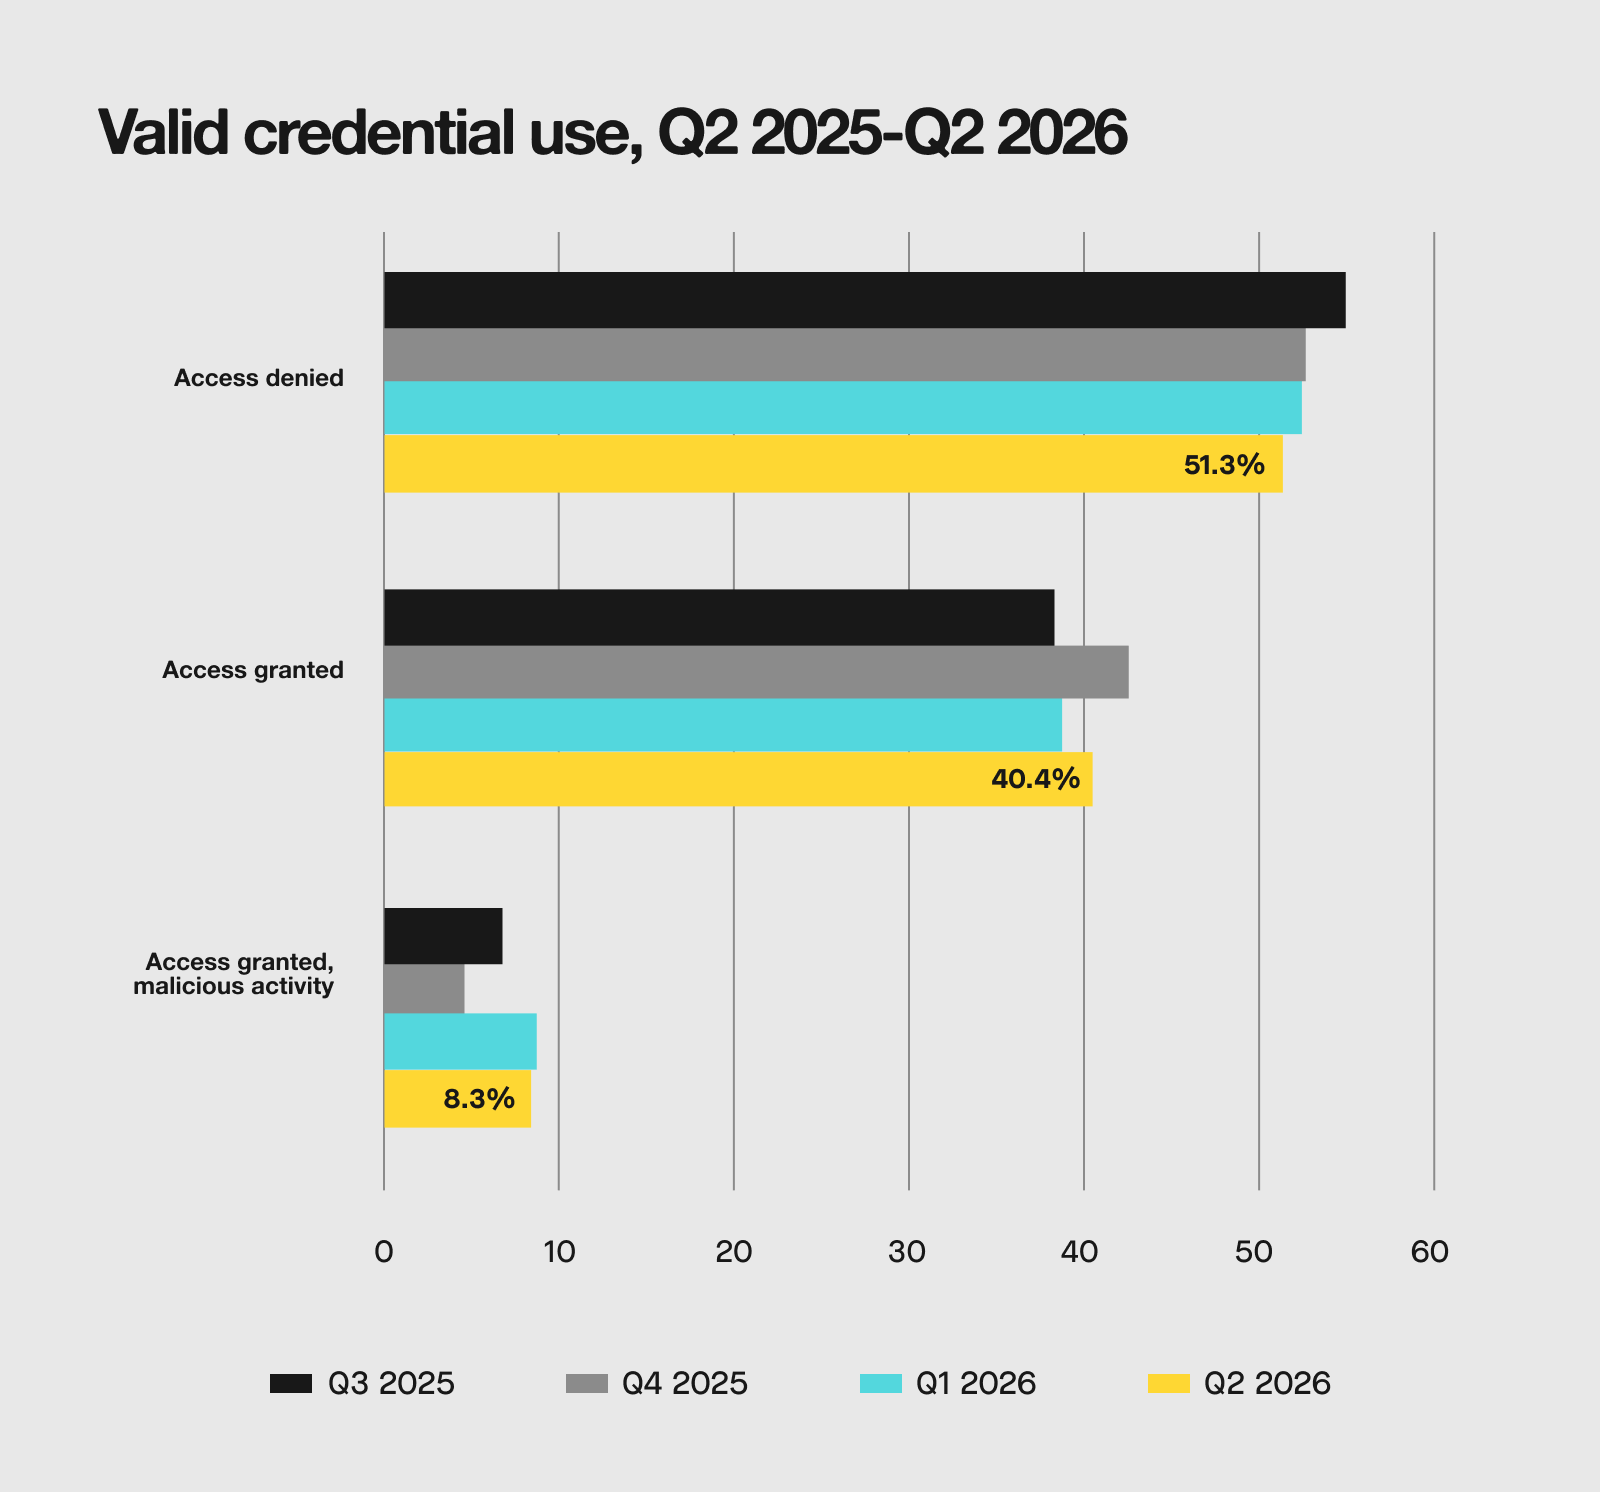
Last quarter, we mentioned the upward trajectory of incidents where access was granted, and malicious activity occurred. This quarter we saw fewer incidents resulting in access but a greater proportion of them had harmful outcomes; this quarter, the increase is in access granted overall—meaning that less authentication attempts were blocked by existing security policies, although it’s unclear why.
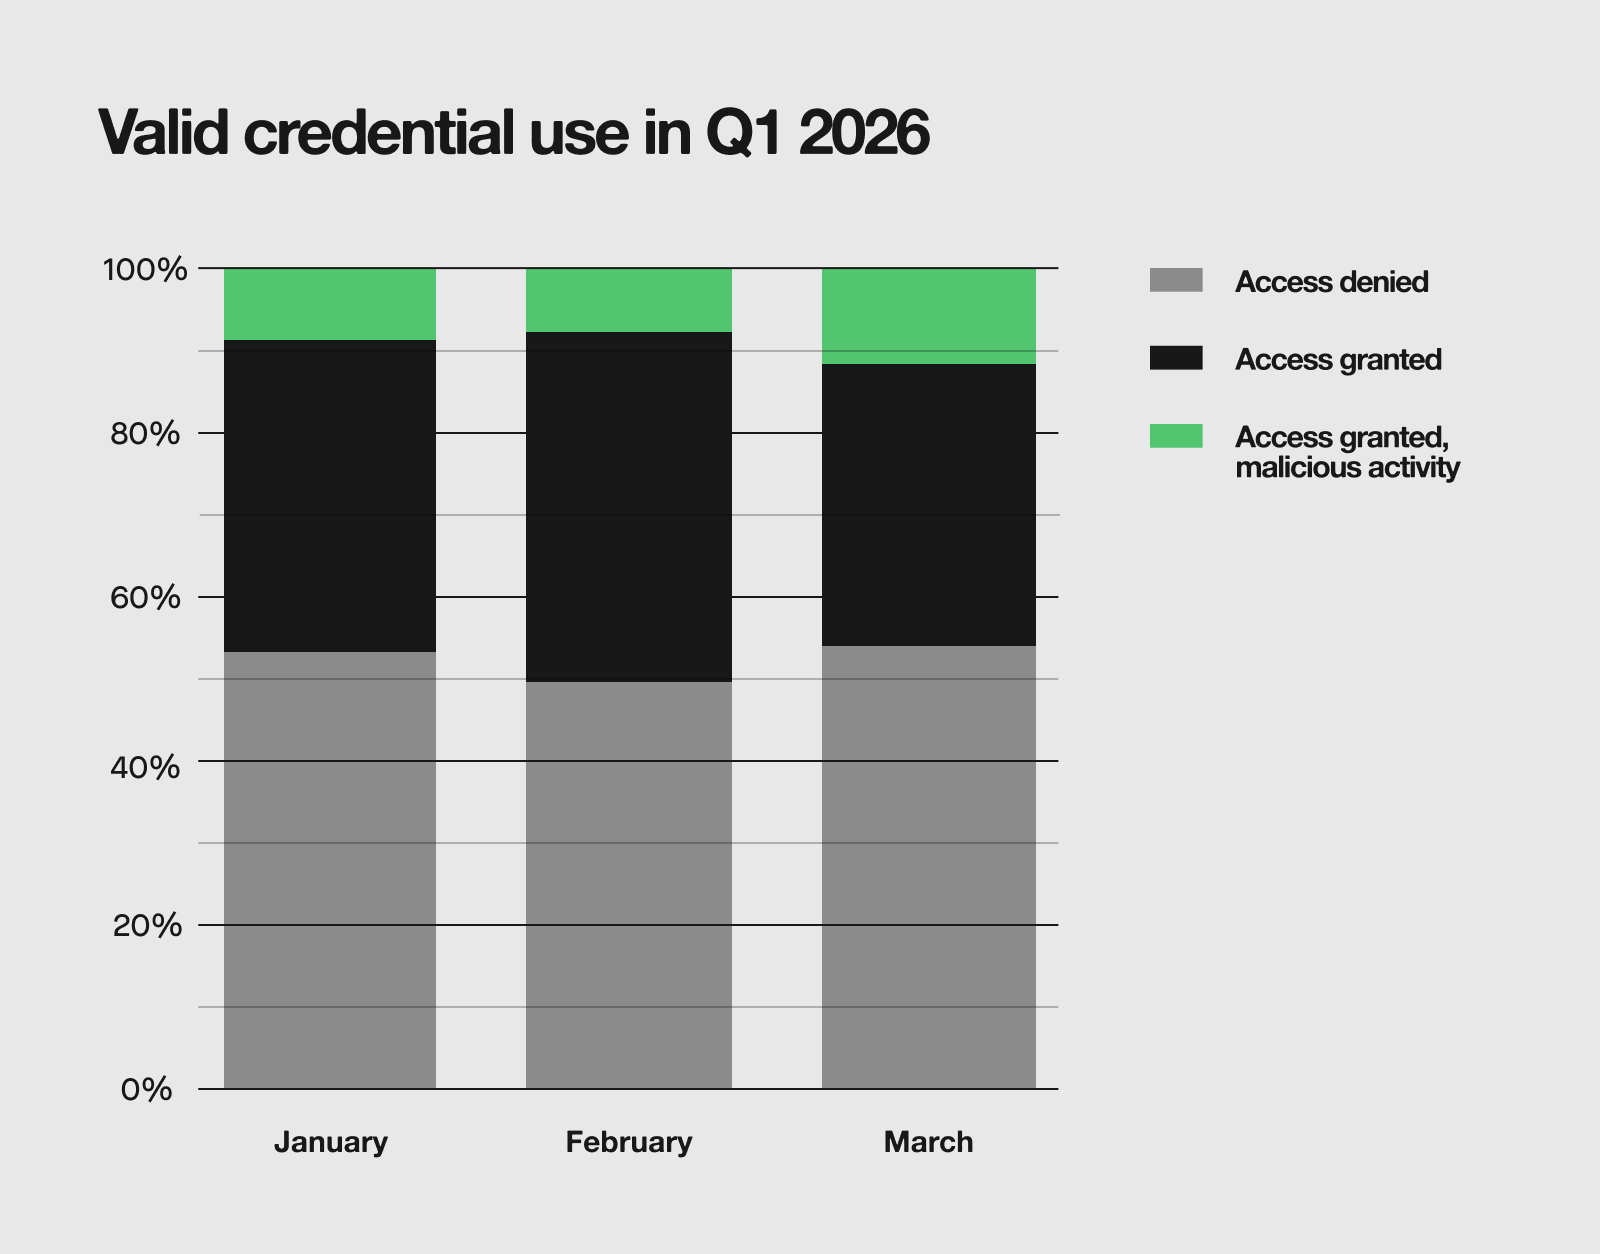
Valid credential use broadly held steady across Q1, but a closer look points at a concerning shift. February stood out as the month where attackers gained the most ground. Combined access granted incidents, which includes those involving confirmed malicious activity, reached 50.4%, meaning more than half of incidents resulted in some level of access.
This level receded in March, which might appear to be an improvement, but the composition of that decline tells a more concerning story. The share of incidents where access was granted and malicious activity followed grew to 11%. In other words, while fewer incidents overall resulted in access in March, a greater proportion of those that did led to harmful outcomes.

ENDPOINT
How are attackers targeting endpoints in Q2 2026?
In Q2 2026, Expel’s SOC saw endpoints targeting by the following:
- 52.7% of endpoint incidents in Q2 2026 were malware
- 23.6% were targeted attacks
- 15.5% were opportunistic attacks
- 7.2% were red team activity
- 1% were server-side vulnerabilities
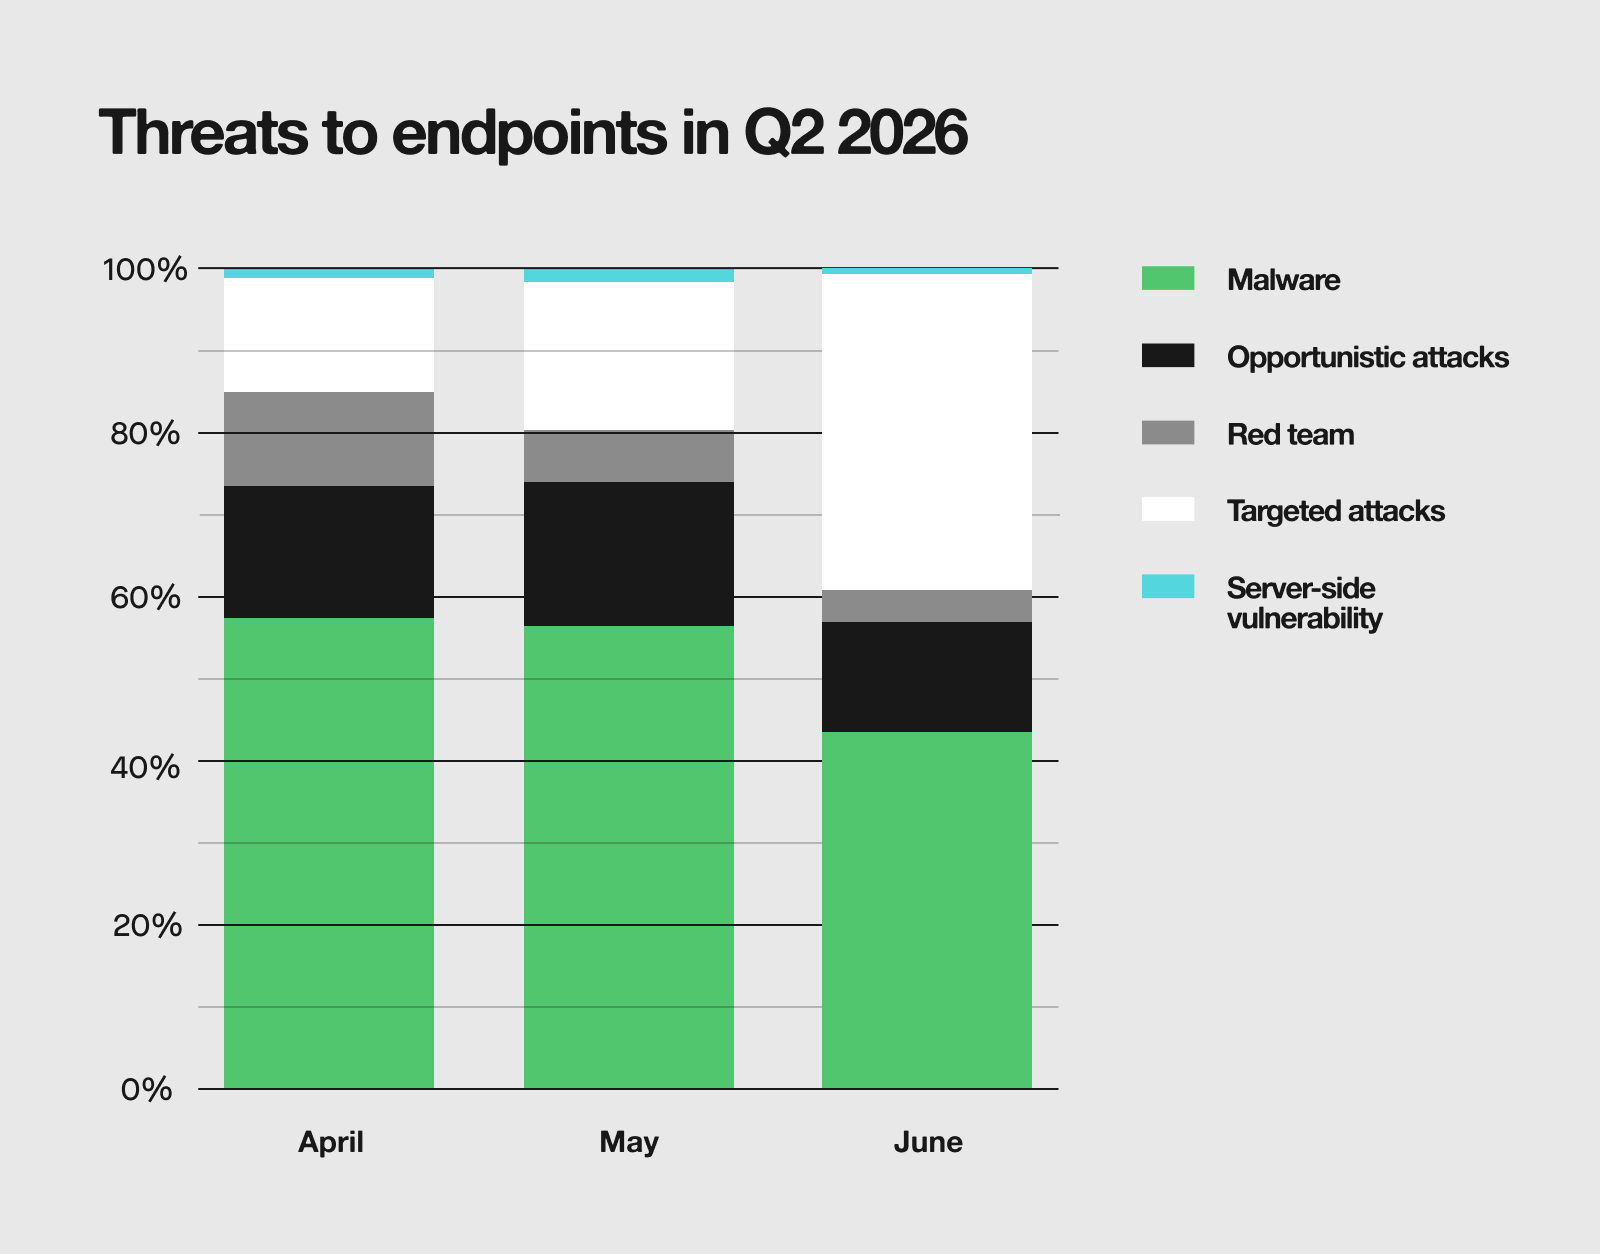
The notable difference between Q1 2026 and Q2 2026 endpoint incident data was that targeted attacks surpassed red team incidents. The biggest shift in targeted attacks was in June, jumping from percentages in the teens (14.6% and 18.3% in April and May, respectively), up to 38.4% in June. The largest contributor to the targeted attack category are Microsoft Teams phishing incidents. We discuss these incidents in length in the quarterly spotlight. These attacks are increasingly common and require dedicated effort to mitigate.
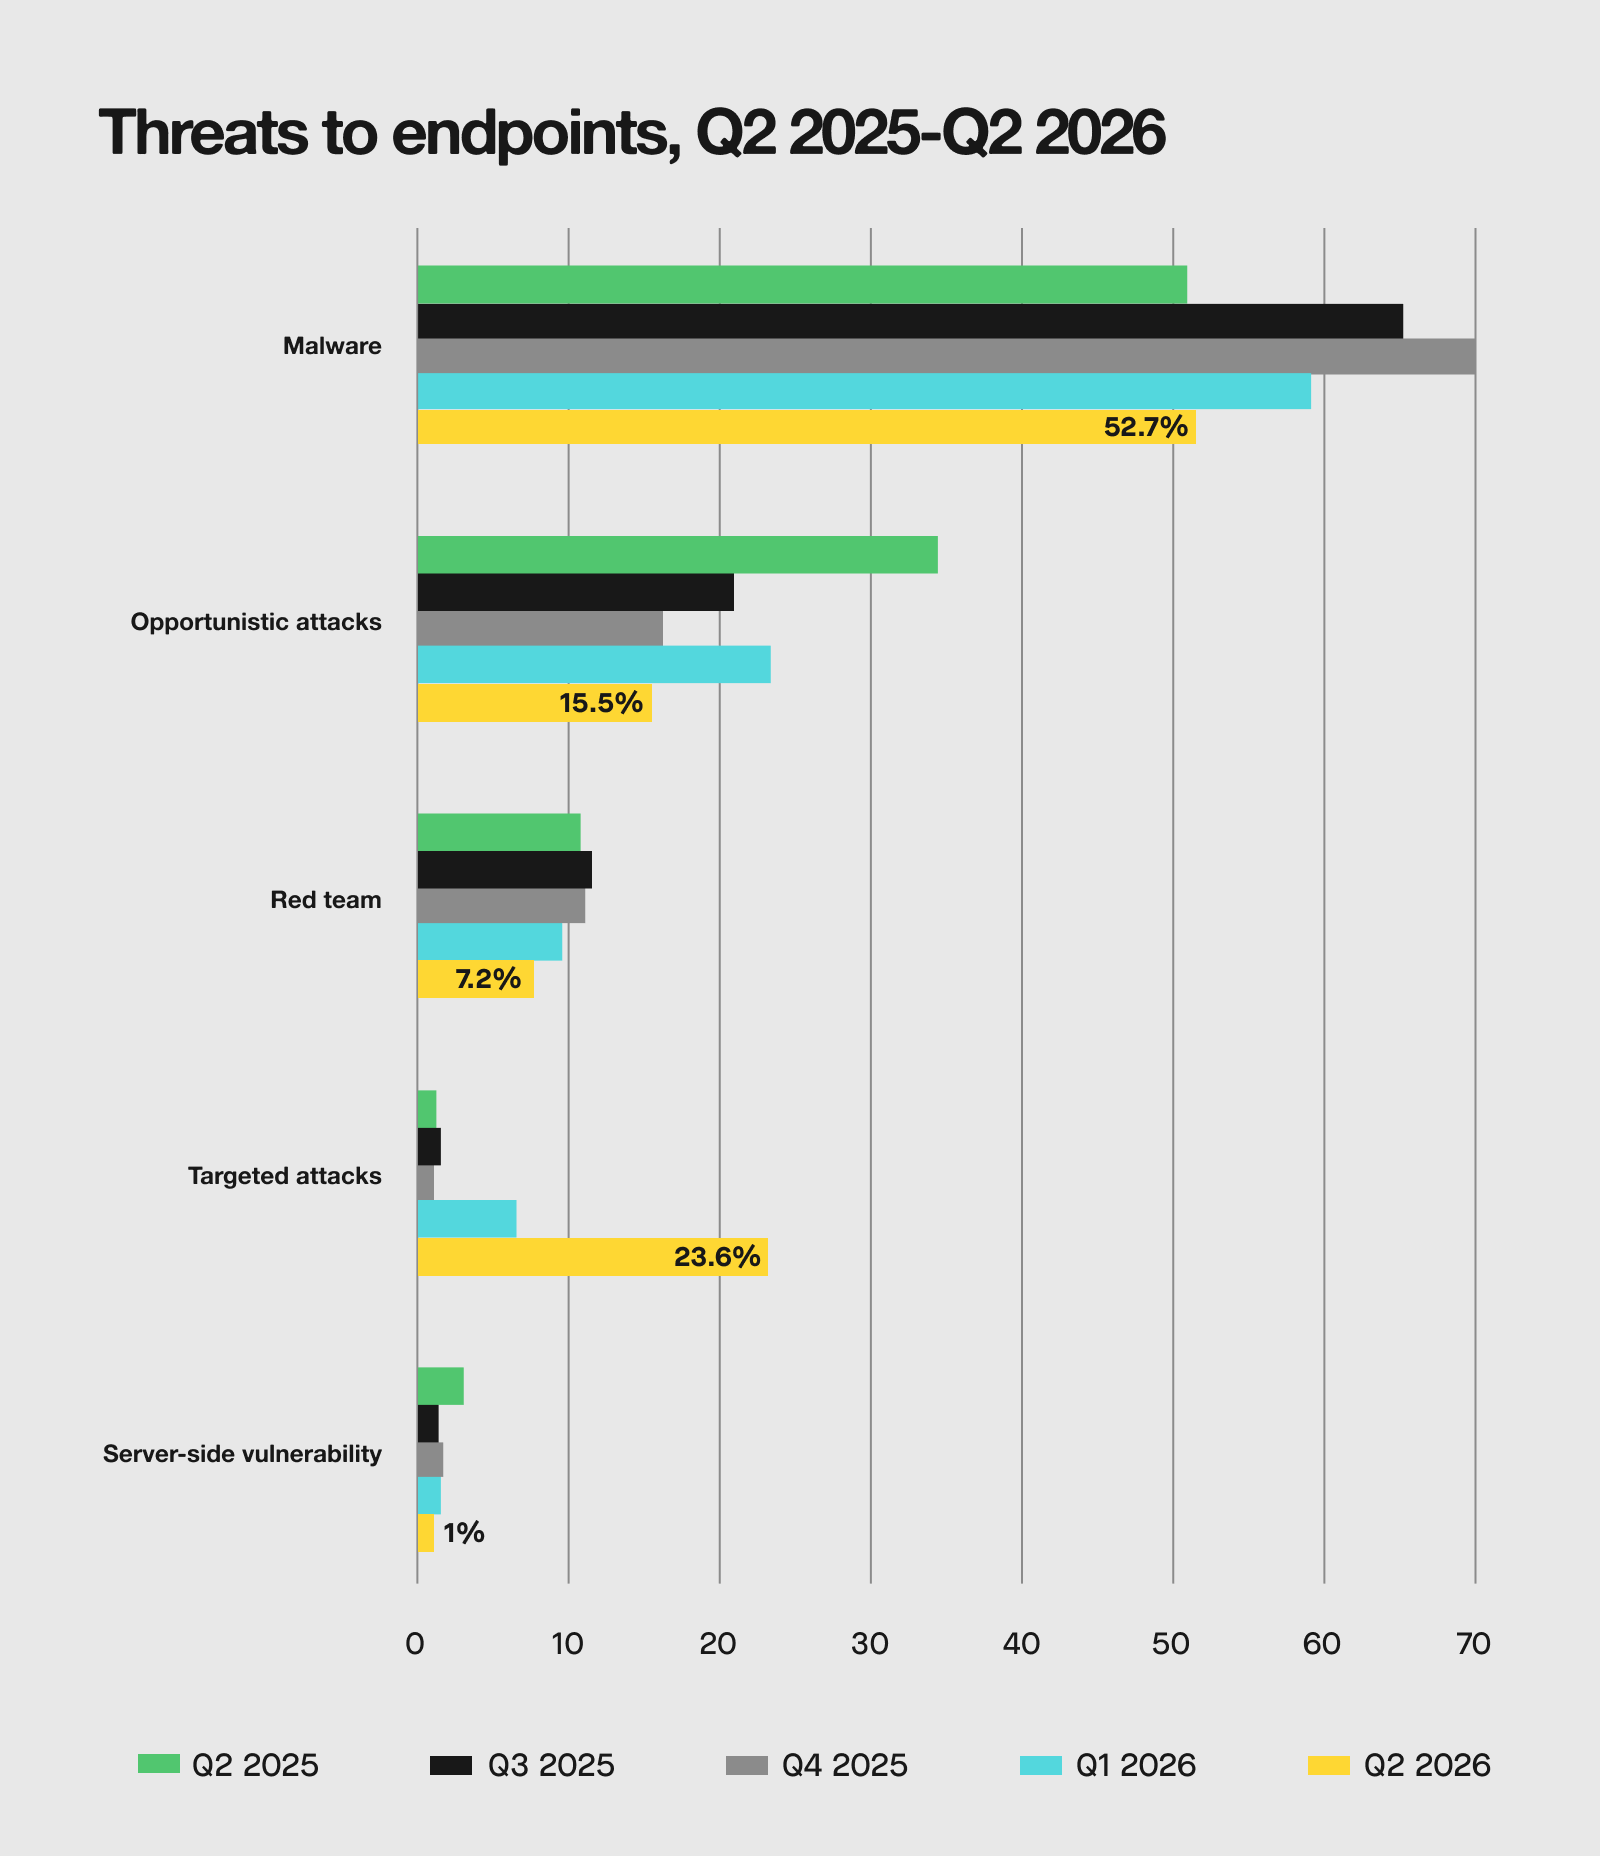
The biggest shift over the last few quarters is the continued rise in targeted incidents. Prior to 2026, targeted incidents generally made up 1% or less of all incidents. However, in this quarter, 26.3% of incidents against endpoints were targeted.
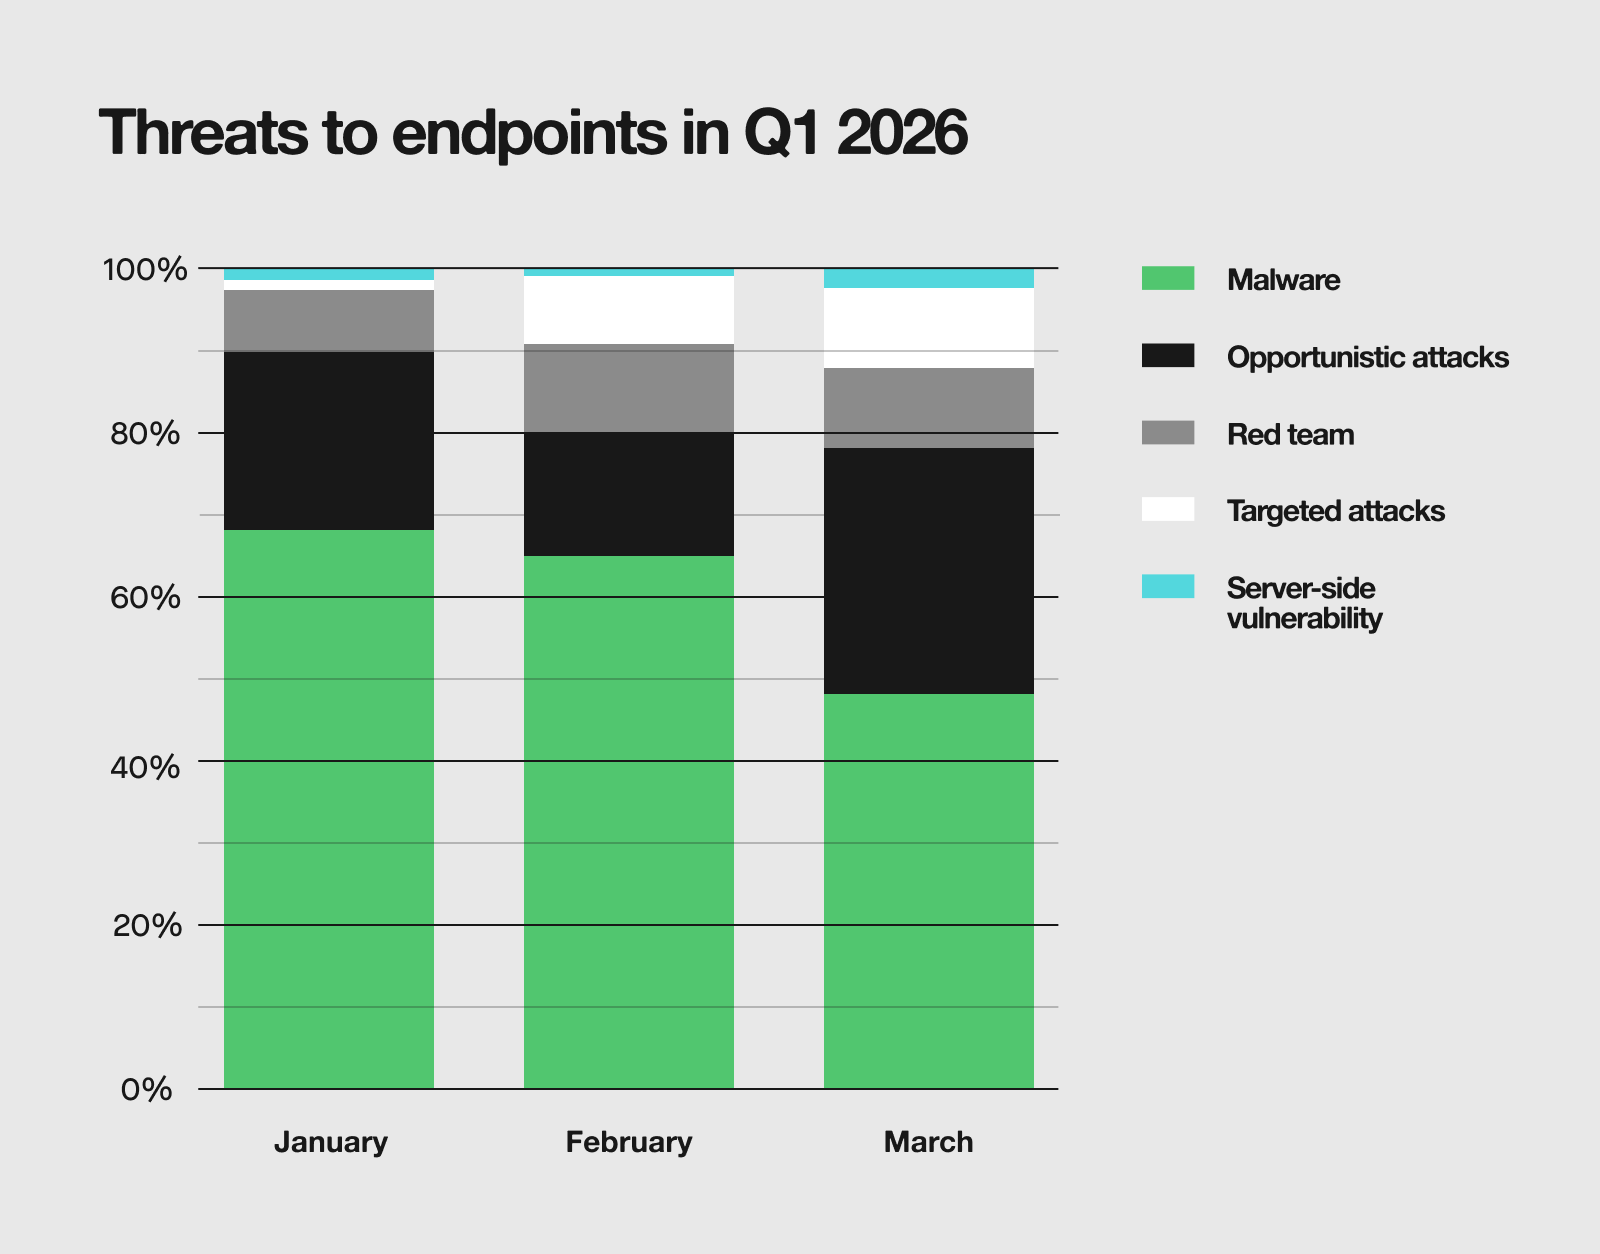
For endpoints, malware remained the dominant threat in Q1 2026. At first glance, malware’s shrinking share as the quarter progressed might suggest a drop in activity. However, the opposite is true—overall endpoint incidents surged in March, with opportunistic attacks more than doubling from February. The volume of malware incidents grew as well. This is a meaningful distinction, because it means organizations weren’t facing less malware, they were simply facing even more of everything else on top of it.

CLOUD INFRASTRUCTURE
How are attackers compromising cloud infrastructure in Q2 2026?
In Q2 2026, cloud infrastructure incidents were tracked as the following types by Expel’s SOC:
- 48.4% of cloud infrastructure incidents were unauthorized access in Q2
- 29% were exposed cloud secrets
- 9.7% were supply chain incidents
- 9.7% were red team activities
- 3.2% were server-side vulnerabilities
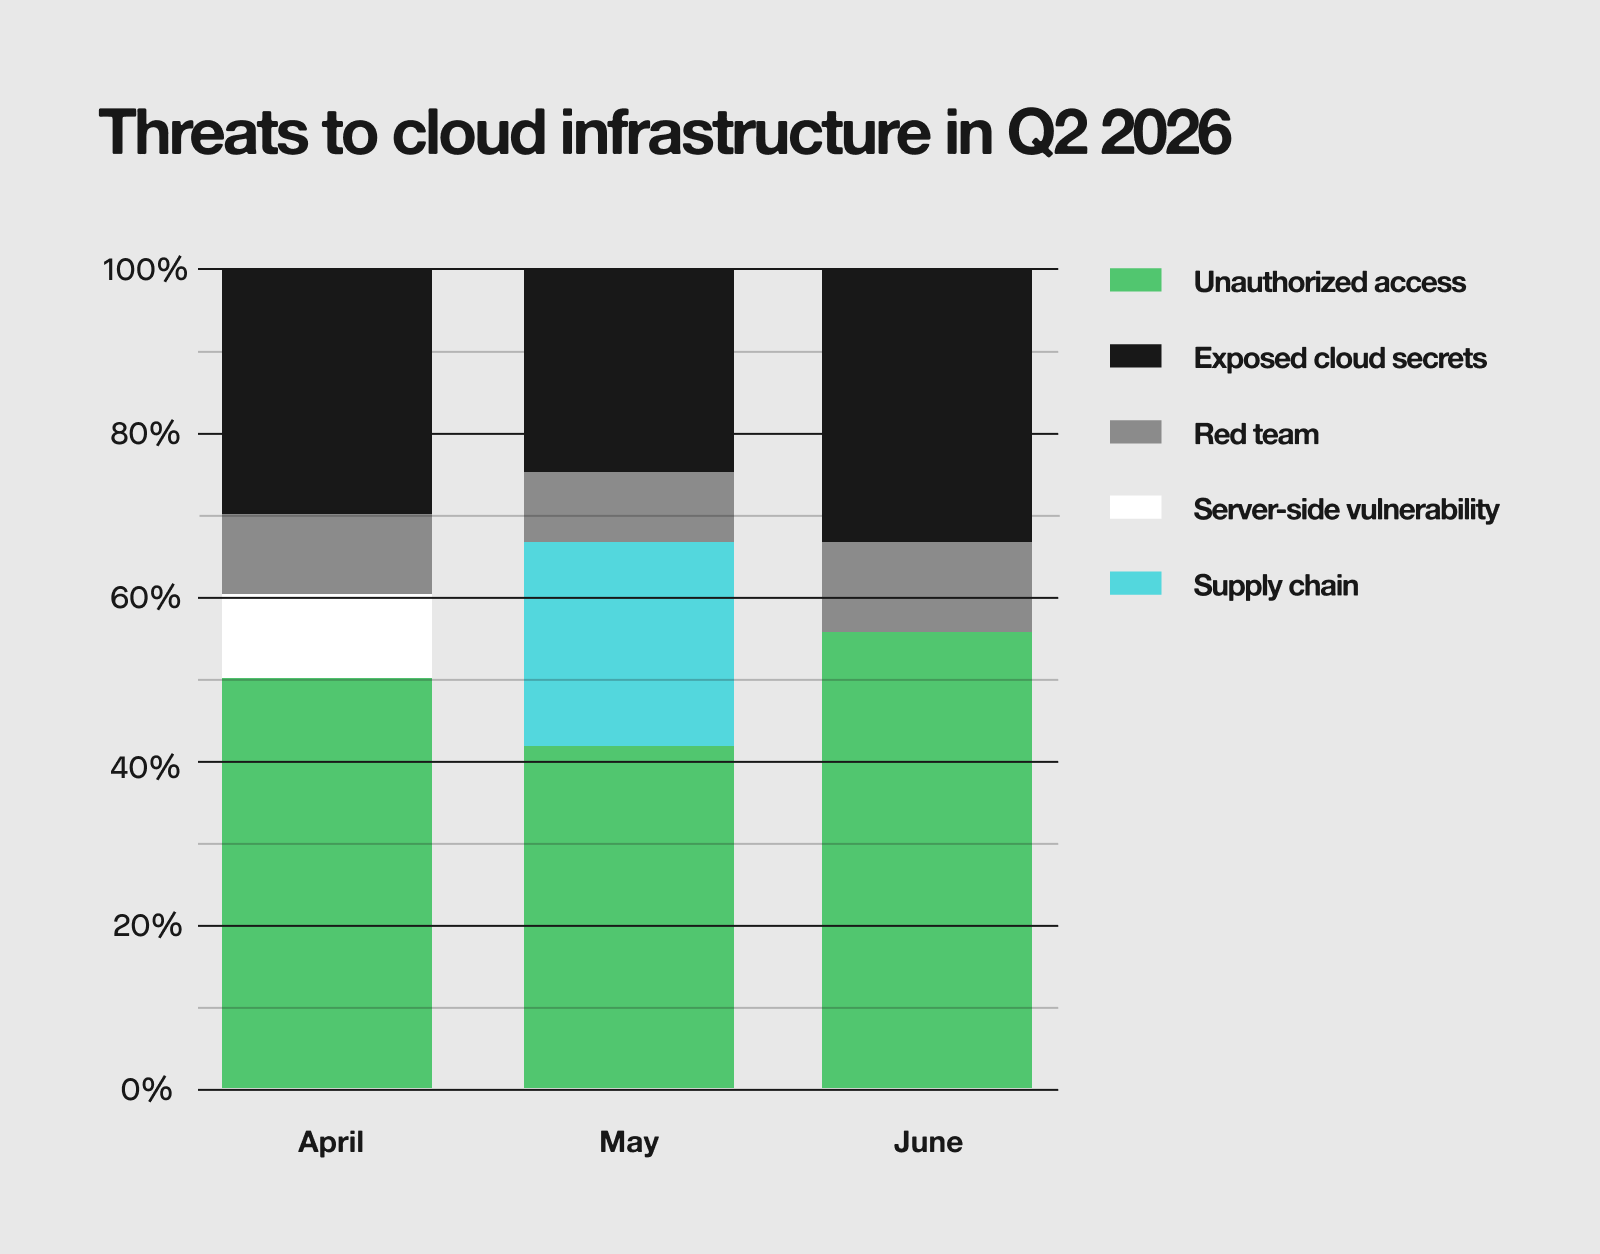
Same supply chain pattern, different threat. Q2 2026 saw a large spike in supply chain incidents in May, similar to the spike in March we saw last quarter due to the Axios npm compromise. This quarter’s culprit was MiniShai Hulud–not related to the original, but named for its similar functionality. Server-side vulnerabilities were low for cloud infrastructure too, not just endpoint, which will remain a data point to keep monitoring.
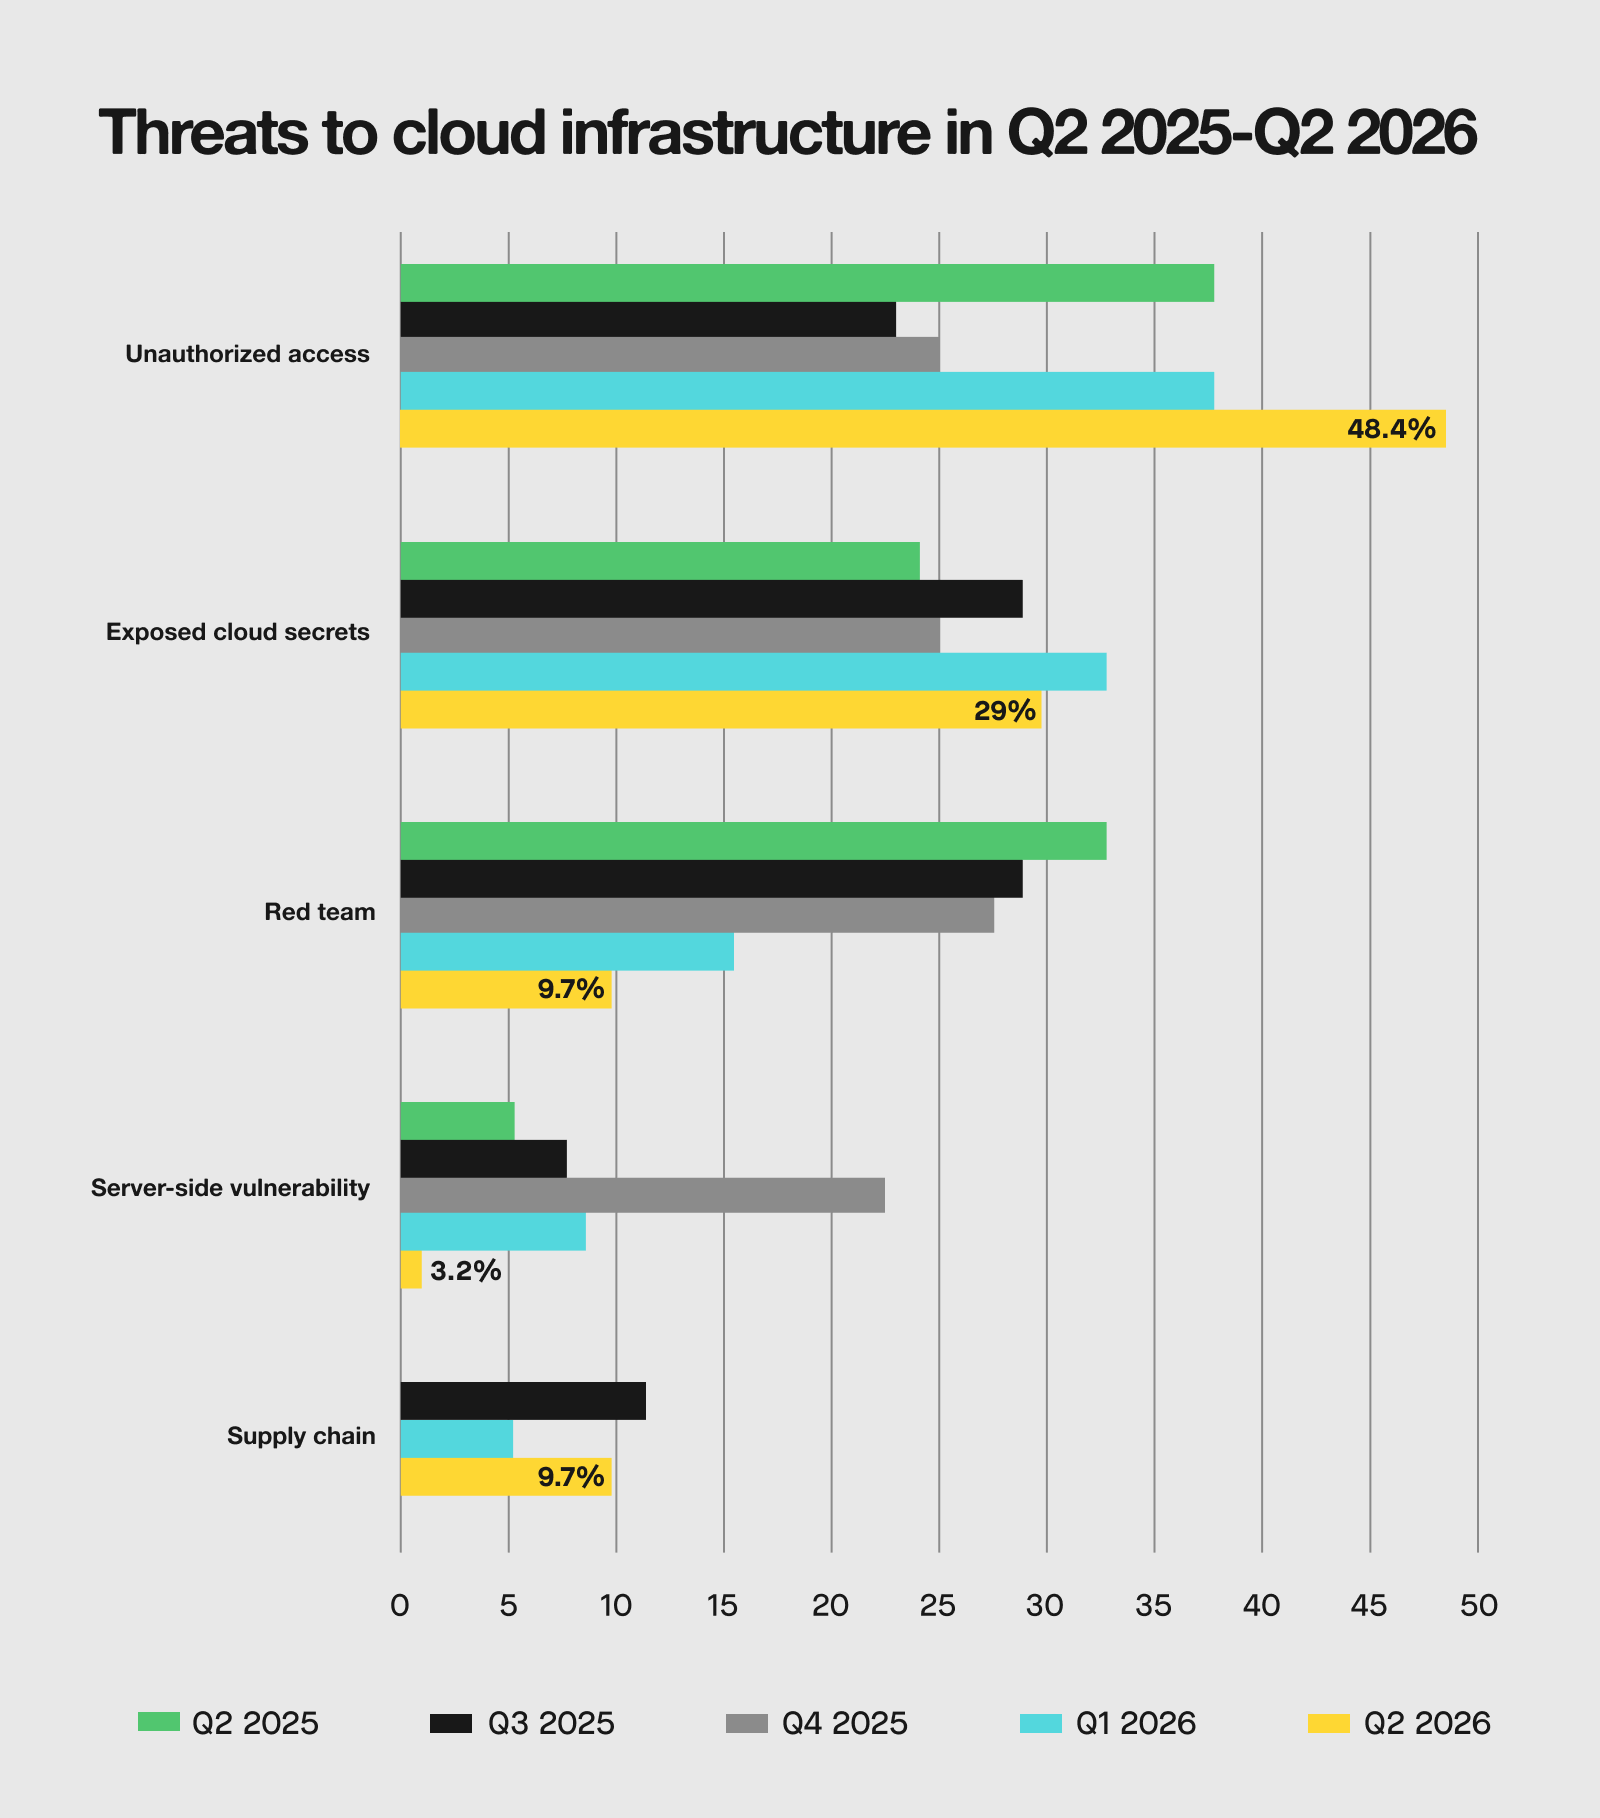
Unauthorized access has hit a peak compared to past quarters, and supply chain has moved up since last quarter, but hasn’t surpassed all previous quarters—this pattern will likely stay the same as supply chain incidents seem to crop up on a more regular basis.
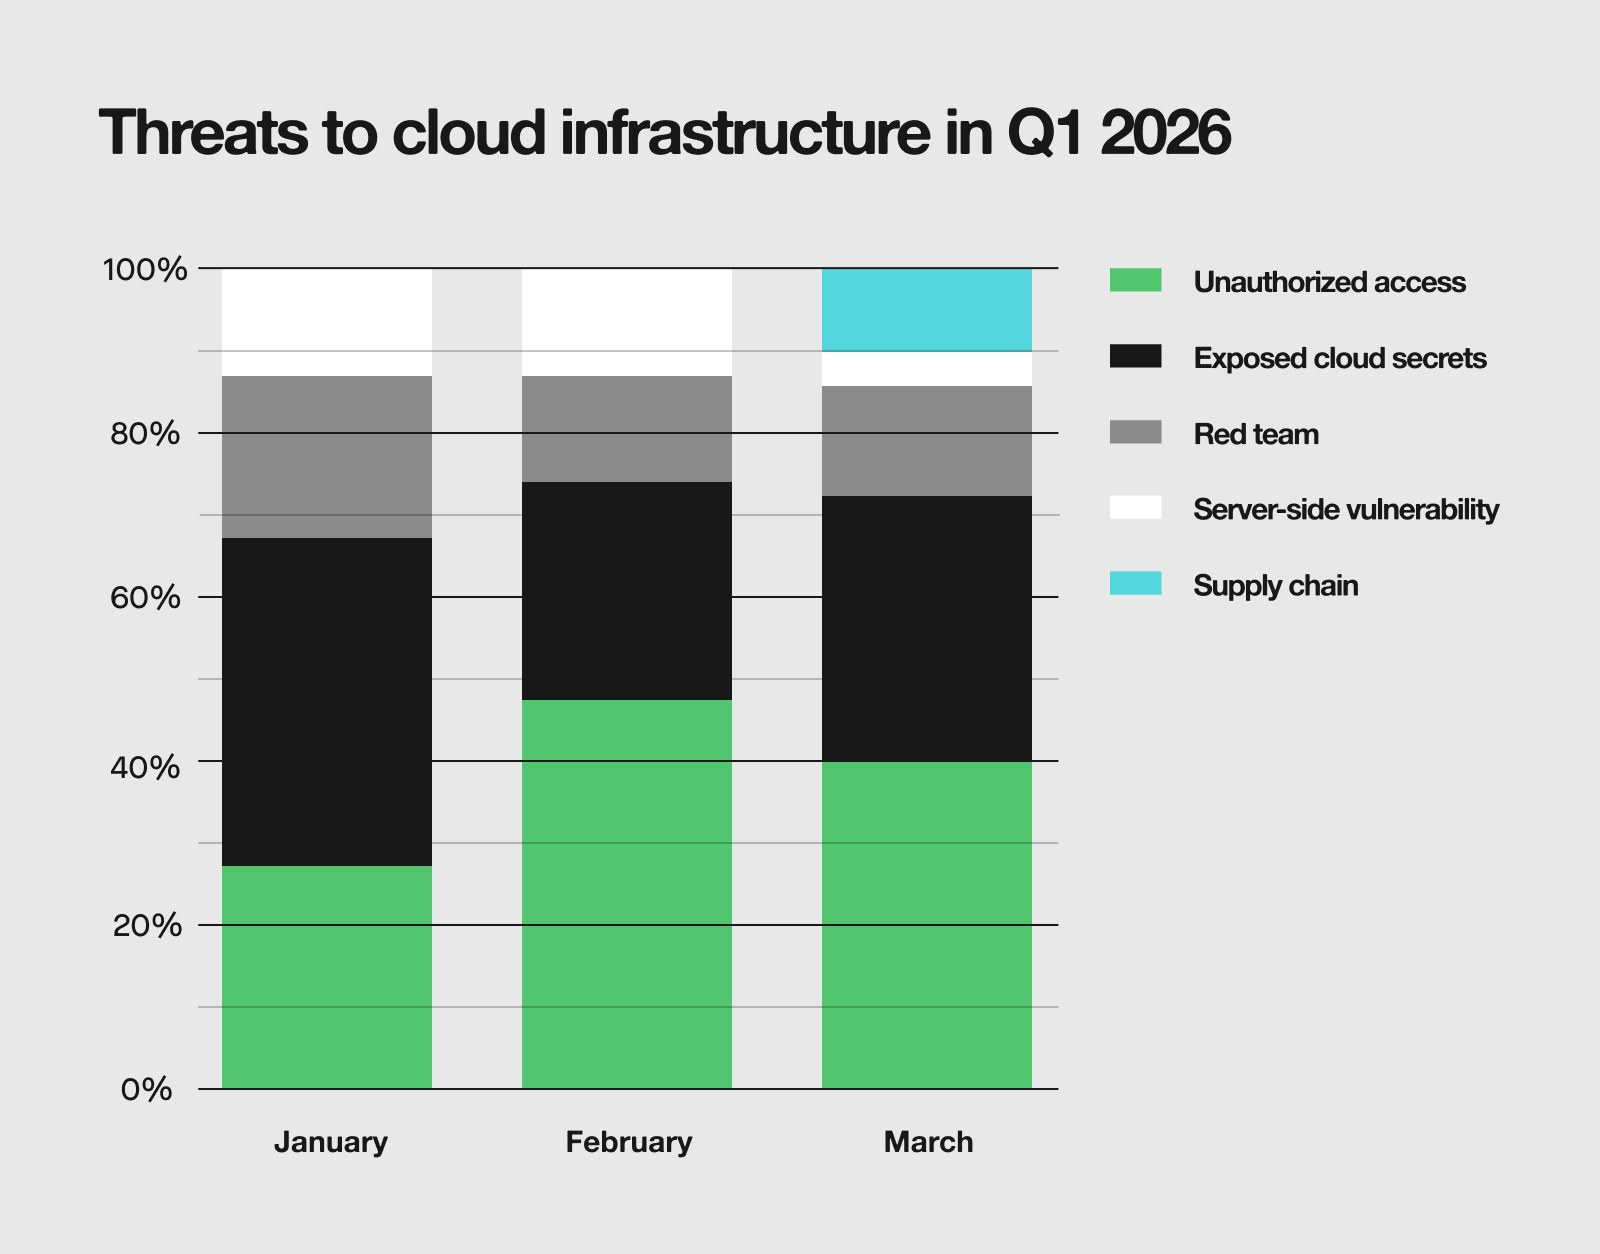
Unauthorized access and exposed cloud secrets were the two main methods used by attackers to gain entry to cloud infrastructure during the quarter. In March, supply chain attacks accounted for 10.7% of incidents, largely attributable to the Axios npm compromise that emerged toward the end of the month. A single third-party library incident accounting for a meaningful slice of an entire month’s cloud threats is a pointed example of how quickly supply chain events can translate into widespread exposure.

Quarterly spotlight
The prevalence of Microsoft Teams phishing (yes, it still matters)
“Most organizations haven’t had to deal with targeted attacks, but many have now due to Microsoft Teams phishing. It’s a targeted attack technique that has and is still plaguing hundreds of businesses because it works. It isn’t like a broad phishing email; attackers take the time to learn about you and your business and strike repeatedly and deliberately over days or weeks to succeed.”

Aaron Walton
Senior Threat Intelligence Analyst, Expel
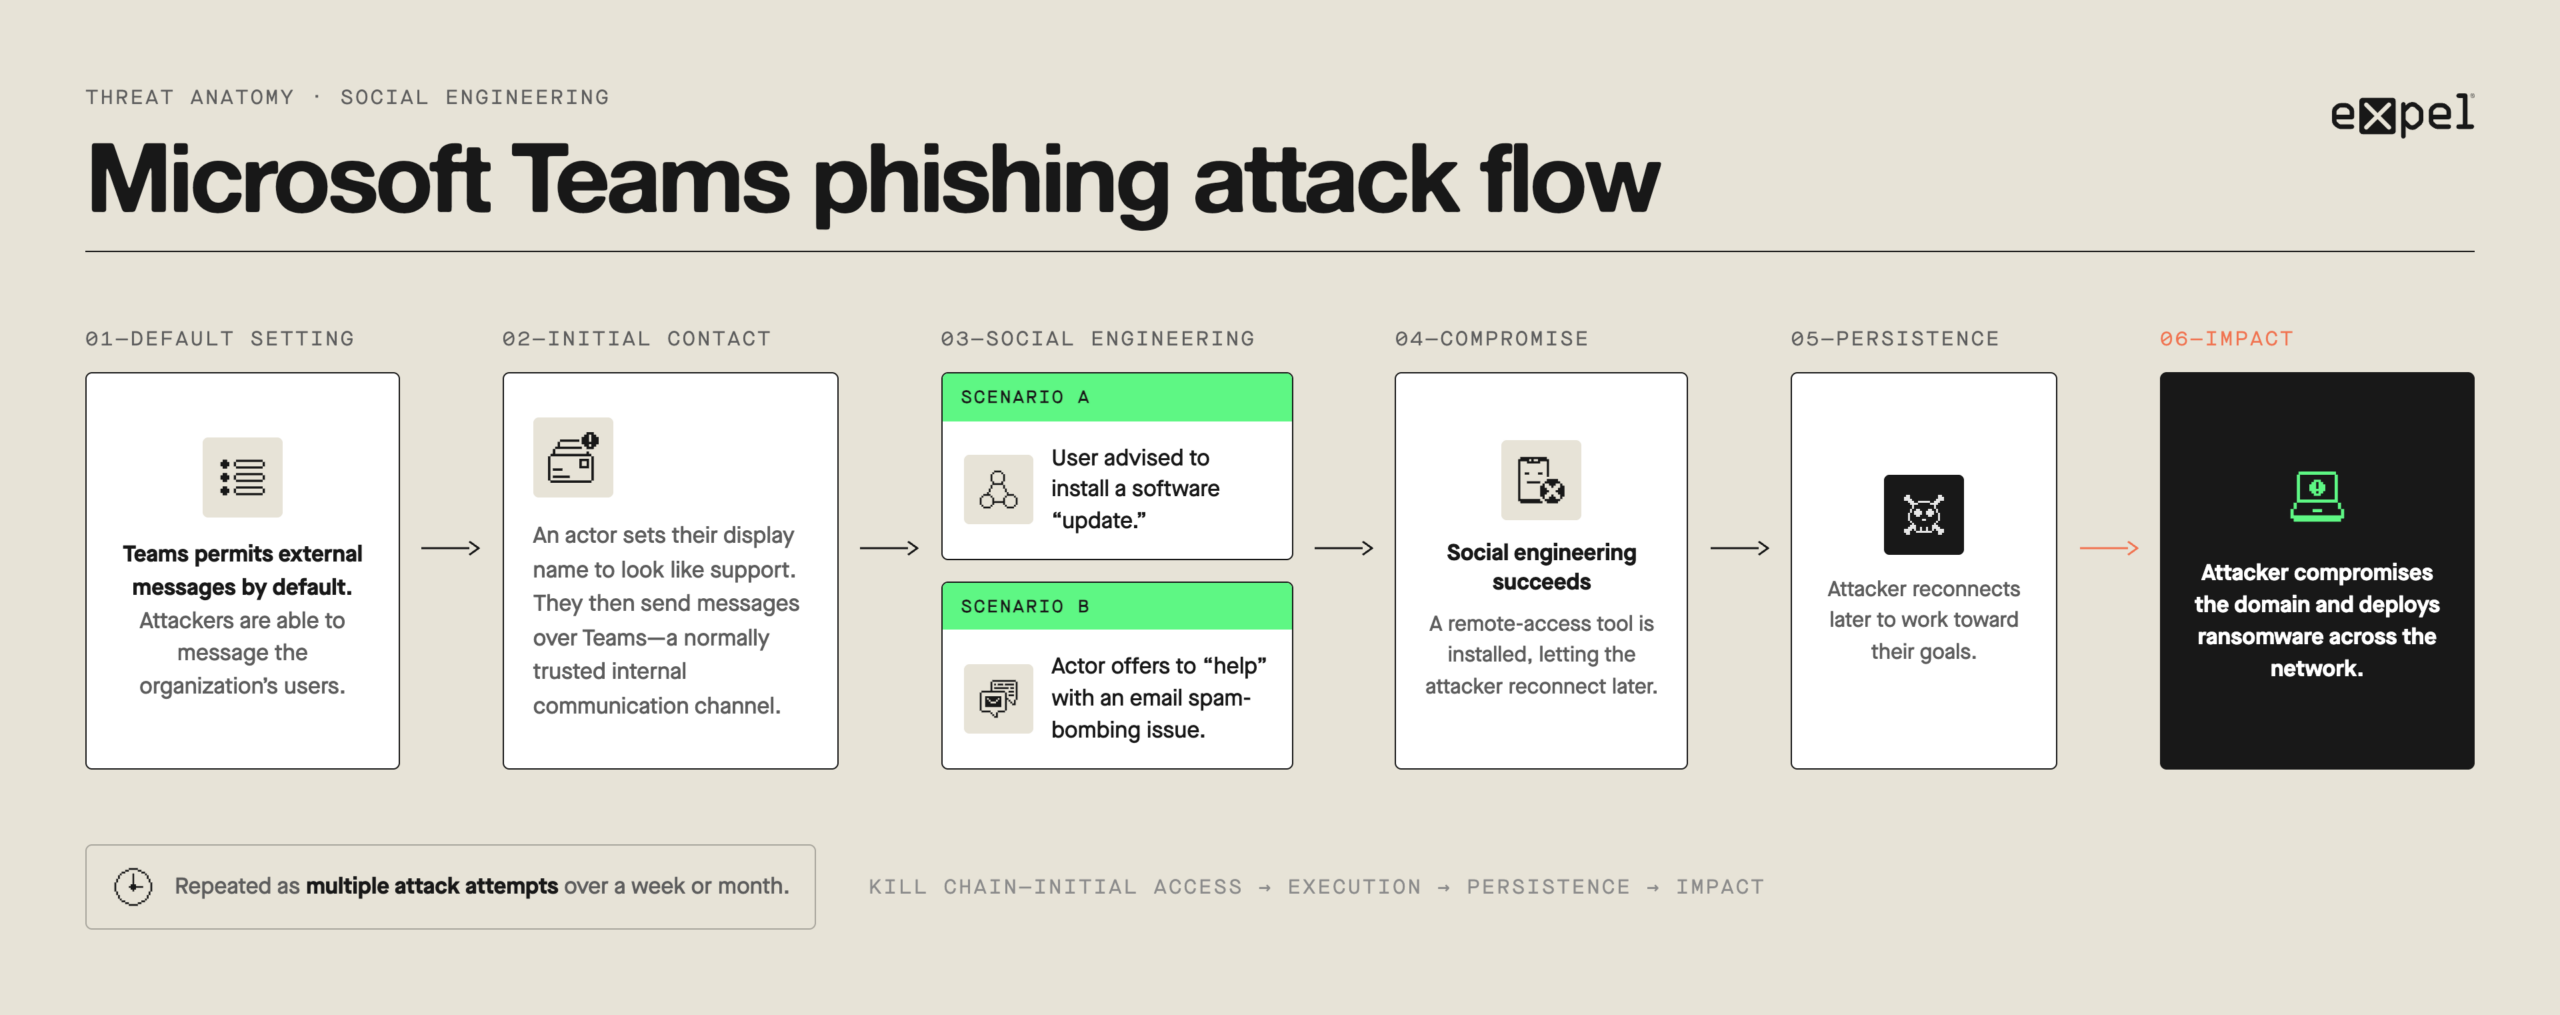
Microsoft Teams phishing is social engineering that occurs via Microsoft Teams. This attack path is possible due to a default setting in Microsoft Teams allowing external organizations to send messages to internal users. The most common attack consists of actors impersonating IT support, either recommending the user to install something or helping them “solve” an email-spam-bombing problem the user is experiencing. In both cases, the end goal is for the attacker to install remote access tools to the victim’s computer, allowing attackers to later connect back to the system with the aim of ransoming the network.
We treat these attacks as targeted within this report and when working with our customers. Threat actors conducting the attacks identify organizations to target and send messages to multiple users within the organization. It’s common to see the actors target an organization several times over a week or even up to a month.
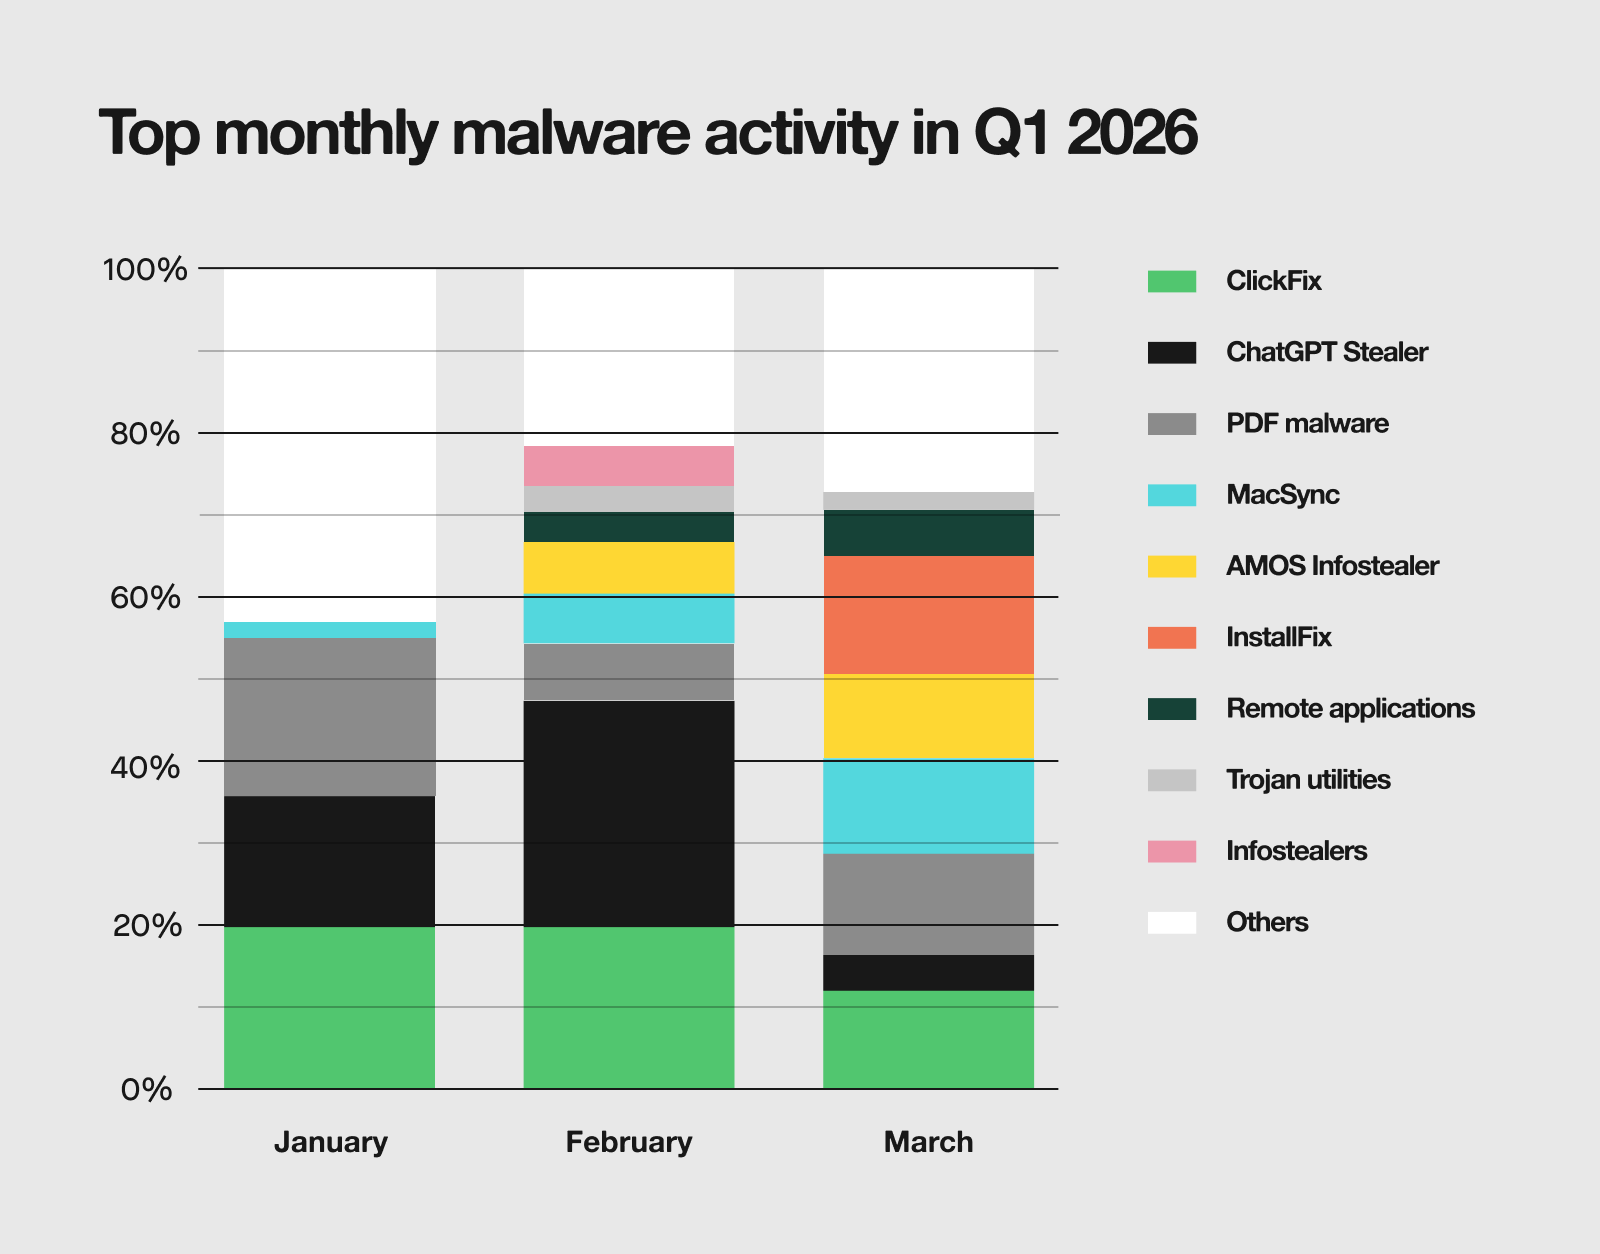
The malware landscape in Q1 was initially dominated by ClickFix and ChatGPT Stealer, which together accounted for a third of all malware incidents in January, and then almost half in February. March, however, brought a notable reshuffling. That top spot was claimed instead by InstallFix, a newly observed variant of the ClickFix technique, which accounted for 14.3% of March incidents.


Frequently asked questions
Expel’s quarterly threat report is a threat intelligence resource published four times per year, based on real incident data handled by Expel’s SOC. It covers the top attack surfaces—identity, endpoint, malware, and cloud infrastructure—with breakdowns by incident type, attacker technique, and delivery method. Unlike a static annual report, the page retains historical data each quarter so readers can track how attacker behavior changes over time.
All data comes from real incidents investigated and remediated by Expel’s SOC across customer environments. It reflects attacker activity observed across identity, endpoint, malware, and cloud infrastructure, and is updated quarterly.
The quarterly threat report is updated four times per year and lives as a single page with rolling data, allowing readers to compare trends across quarters. The annual threat report is a comprehensive, point-in-time analysis published once per year with broader findings and forward-looking predictions.
According to Expel’s SOC data, identity-based incidents remained the top attack surface in Q2 2026, accounting for 68.1% of all incidents—up from 58.7% in Q1. Endpoint incidents declined to 29.8% of the total, while cloud infrastructure incidents held steady at 2.1%. The quarter’s biggest driver was a sharp rise in targeted endpoint attacks, climbing from the mid-teens in April and May to 38.4% in June, almost entirely attributable to Microsoft Teams-based phishing.
Microsoft Teams phishing continues to be one of the most persistent threats Expel’s SOC observes. It exploits a default Teams setting that allows external organizations to message internal users. Attackers typically impersonate IT support, prompting victims to install remote access tools. In Q2 2026, targeted endpoint attacks increased month-over-month, underscoring how organized and sustained this tactic has become.
In Q2 2026, 51.3% of identity incidents investigated by Expel’s SOC resulted in access being denied, 40.4% resulted in access granted without confirmed malicious activity, and 8.3% resulted in access granted with malicious activity detected. Both May and June saw access-granted rates climb above 50%, with malicious activity also increasing month over month; a shift from Q1, when overall access rates fell but a greater share of successful logins led to real harm.
Unauthorized access (48.4%) and exposed cloud secrets (29%) remained the top two cloud infrastructure threats Expel’s SOC tracked in Q2 2026. Supply chain incidents also spiked in May, driven largely by Mini Shai Hulud, a newly identified worm targeting the npm and PyPI ecosystems, echoing a similar spike from the Axios npm compromise in March. Supply chain attacks now appear to be a recurring risk for cloud environments rather than an isolated event.