
TL;DR
- This is part one of two of our Quarterly Threat Report blog series for Q3 2025
- You can find part two here; it covers the threat intel from Q3
- Part one covers the overall stats regarding incidents our SOC investigated this past quarter
Welcome to the Expel Quarterly Threat Report (QTR) for the third quarter (Q3) of 2025 (July–September). The QTR looks back at the attacks we’re seeing over the quarter, sharing the trends we’ve seen in the incidents we’ve handled.
Let’s start things off this quarter and dive into the Q3 numbers!
About these reports
The trends in our QTR are based on incidents our SOC identified through investigations into alerts, email submissions, or threat hunting leads in Q3 of 2025. We analyzed incidents across our customer base, which includes organizations of all sizes, in many industries, and with differing security maturity levels. In the process, we’ve identified patterns and attacker tendencies to help guide strategic decision-making and operational processes for your organization.
Q3 by the numbers
Incidents encountered by the Expel SOC
From July to September 2025:
- Identity-based attacks comprised almost three-quarters (73.9%) of incidents we investigated. This is up from 67.6% last quarter.
- Non-targeted malware accounted for approximately 15.4% of all incidents.
- The volume of incidents related to cloud infrastructure (things like AWS, Azure, Kubernetes, etc.) comes in around 1.1% of total incidents.
- The remaining incidents were split between non-targeted attacks (around 6%), incidents identified as red team or pen testing exercises (around 3.4%), and a small number of targeted attacks (less than 1%).
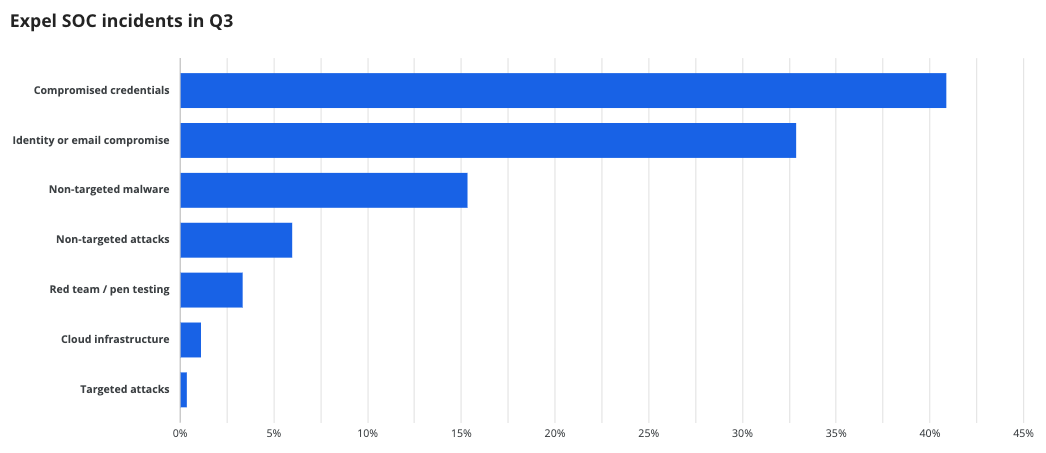
Identity-based attacks continue to be the predominant threat our SOC encountered. The combined categories of compromised credentials and identity or email compromise account for a significant majority of all incidents we investigated this quarter.
Cloud-based services (identity)
With identity being the primary attack vector this quarter, we continue to observe threat actors employing two main approaches when targeting cloud-based services.
Compromised credentials are cases where an attacker has managed to obtain credentials but were prevented from accessing the account due to various controls in place. This quarter, 54.9% of incidents involved compromised credentials.
Our other category, identity or email compromise, made up 45.1% of incidents. These are instances where an attacker successfully obtains and utilizes a user’s login credentials in email applications, identity verification systems, or other business applications.
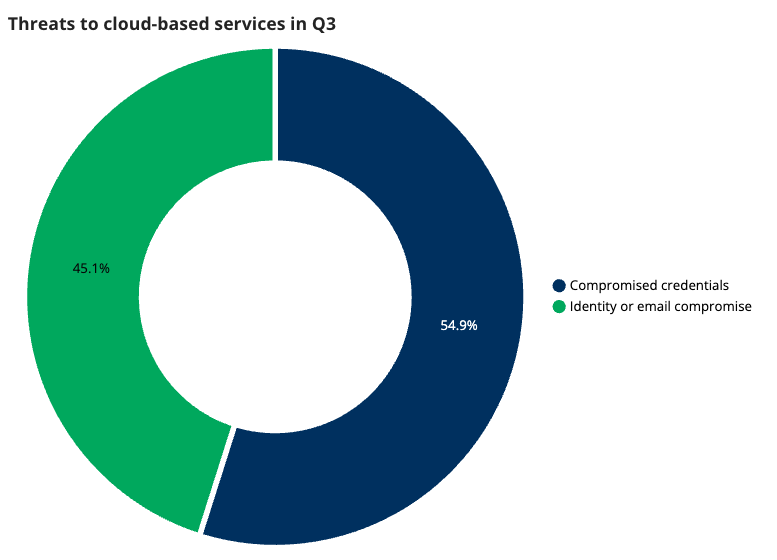
The good news here is things appear to be trending in the right direction. Over the last three quarters, we’ve watched the percentage of identity or email compromise incidents decline. As it stands, 54.9% of incidents fell into the compromised credentials category, meaning a higher percentage of incidents where the attackers attempted to use credentials were blocked, rather than leading to a successful account compromise.
Regardless, the high volume shown for both categories reinforces the necessity of adopting modern identity controls to protect your environment. Attackers are clearly prioritizing identity as a means to entry and organizations should respond accordingly.
Endpoints
We classify incidents raised by alerts from EDR and XDR applications as part of our endpoint category. This covers incidents like a user downloading malware or an attacker’s hands-on attempt to compromise a system. This category can give us a good idea about the types of attacks bad actors are carrying out against devices within the network.
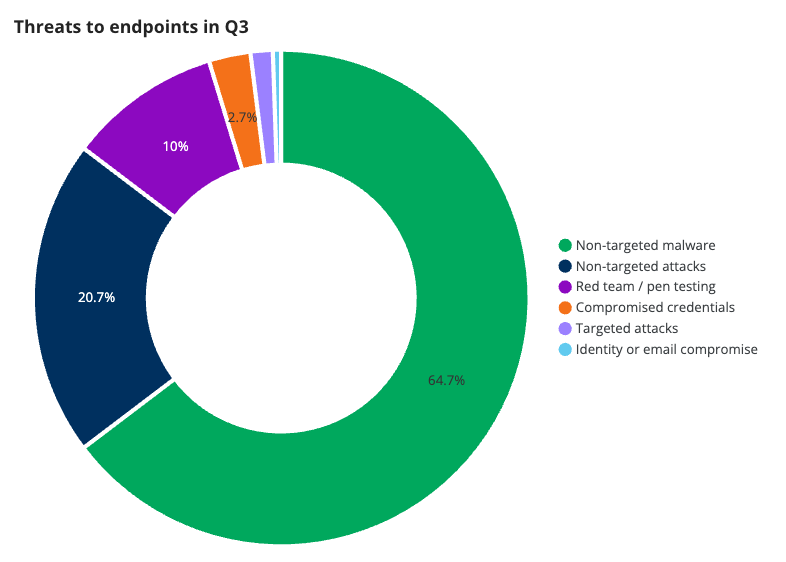
As seen in the overall numbers, non-targeted malware remains a primary threat vector for endpoints. Of the threats seen on endpoints, it accounts for 64.7% of all incidents across our customer base.
In Q2, we saw a drop in incidents involving non-targeted malware (50.2%) and an increase in non-targeted attacks (35.3%). This quarter, the numbers appear to have swung back to the similar percentages that we saw back in Q1—64.7% of incidents involved non-targeted malware and 20.7% involved non-targeted attacks. This increase of non-targeted malware incidents was largely driven by BaoLoader malware, which was pushed heavily via advertisements. We’ll talk more about BaoLoader in our second blog.
Cloud infrastructure
While this category comprises a low percentage of overall incidents, the types of attacks targeting cloud infrastructure are becoming more diverse across the categories we track.
We track three primary types of threats to cloud infrastructure. Unauthorized access are incidents where threat actors have managed to gain access to cloud infrastructure due to a misconfiguration or vulnerability. Second are incidents deemed to be the result of red team and pen testing exercises. Finally, secret key exposure incidents are cases where bad actors have managed to get ahold of the secret keys used to access a cloud instance.
This quarter, the largest increases we’ve seen have been in incidents involving secret key exposure. At 26.8% of incidents, we have seen a 7.8 percentage point increase from Q2. Secret keys are most often exposed accidentally after being hard coded into source code or applications, but they can also be exposed through malware (like the Shai Hulud supply chain attack, for example).
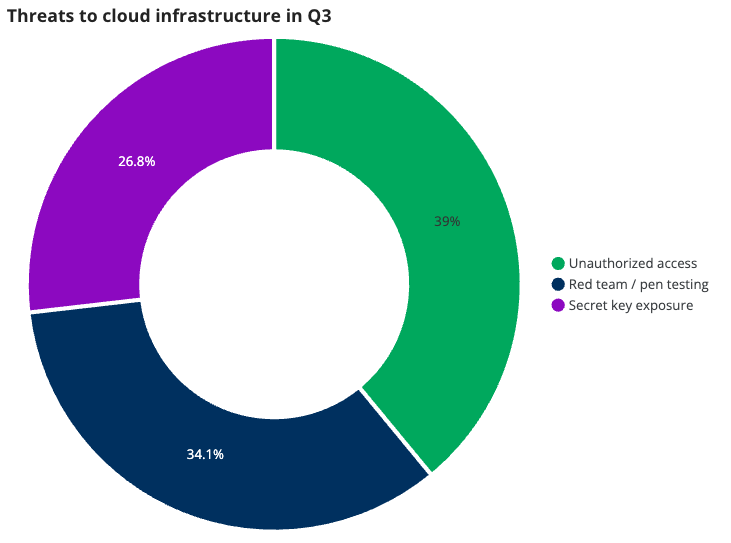
Overall, unauthorized access remains the top threat to cloud infrastructure, making up approximately 39% of incidents in this category.
Incidents involving red team or pen testing exercises accounted for around 34.1% of cloud infrastructure activity. This high percentage, compared to overall volume, suggests organizations are proactively testing this attack surface.
Attack surfaces as a whole
The one thing that’s clear when looking at attack surfaces is how each is distinct from one another. Attackers obtain and utilize stolen credentials or phishing campaigns to gain access to cloud-based services. Traditional tactics, such as malware and compromising public-facing systems, dominate the endpoint surface. And misconfigurations tend to be common in the case of cloud infrastructure.
The takeaway? There are stark differences between these attack surfaces, which is why it’s important for security teams to have different defensive plans ready for each. The fact of the matter is attack approaches are varied enough across these surfaces, and having strategies to defend against only one or two of them likely won’t protect against attacks targeting the others.
Up next, we’ll see how these different categories looked across industries.
Industry incident types
We protect a wide variety of industries. In the following chart, we highlight the top ten industries with the most incidents so you can plan accordingly.
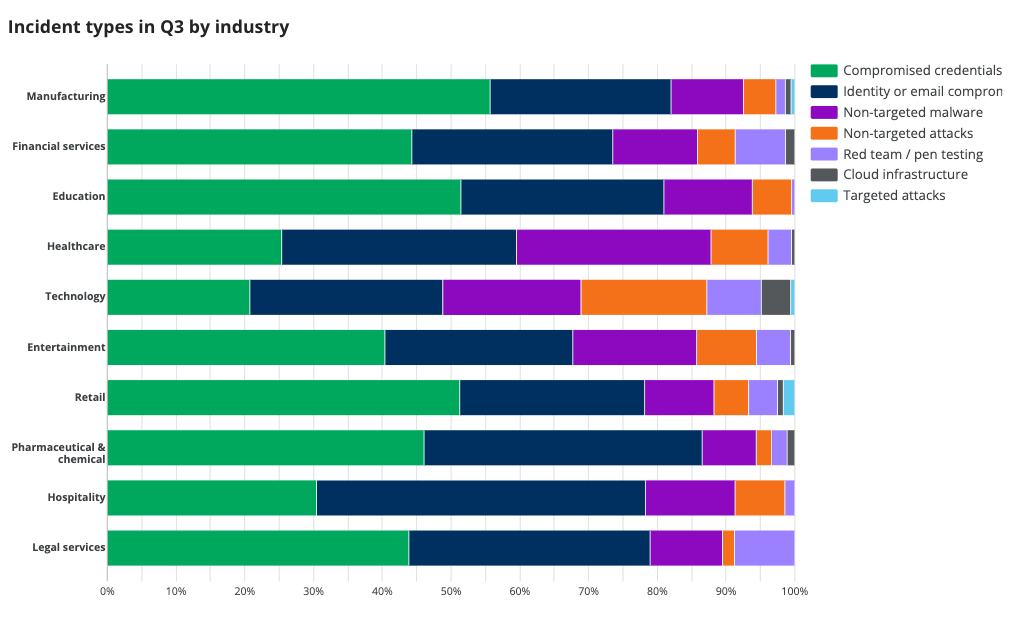
The top ten industries, ranked from most to least incidents, were:
- Manufacturing
- Financial services
- Education
- Healthcare
- Technology
- Entertainment
- Retail
- Pharmaceutical & chemical
- Hospitality
- Legal services
A few key takeaways from this industry-specific analysis:
- Manufacturing saw the highest volume of total incidents, passing financial services, which topped the list the last two quarters. Compromised credentials and identity or email compromise making up the bulk of the activity in this sector.
- The healthcare industry was disproportionately affected by non-targeted malware, which accounted for a larger slice of their total incidents than the average across industries.
- While high across all industries, the pharmaceutical & chemical sector saw the highest proportion of identity-based attacks in the top ten.
Coming up
That’s it for our Q3 2025 summary! Now that we’ve covered incidents by volume, attack surfaces, and industry, stay tuned for the next post where we’ll dive deeper into the major threats and threat intel from the past quarter.

")

")