Expel analysts get to use a lot of really cool technology including Darktrace and Carbon Black (Cb Response). It’s one of the perks of delivering a service that integrates with so many tools. Each product we use is critical to an investigation. But they provide value in different ways. For example, some help us detect, while others are more valuable when we’re scoping an investigative lead.

What’s an investigative lead you say? Well … that’s basically how we think of alerts. And we see our job as following the trail of those leads so we can give our clients answers. For this, we rely on an investigative mindset – which we apply to all of the network, endpoint and SIEM products we use during an investigation.
In this post, I’m going to focus on Darktrace. I’ll highlight some of our favorite features and then dive into a typical investigation to show you how our analysts triage a Darktrace alert. In this case, we’ll be looking at an anomalous connection that Darktrace identified and I’ll share some of the investigative techniques we commonly use to filter down the available data.
A quick overview of Darktrace
If you’re not familiar with Darktrace, there are a few things you should know. First and foremost, it’s a far cry from your traditional IDS/IPS. In fact, Darktrace is completely signatureless. Instead, it creates a “model” of what “normal” network activity looks like for your organization. When network traffic deviates from that model, Darktrace flags it as suspicious activity. Then, Darktrace tunes these models with machine learning and artificial intelligence and enriches the involved hosts with Active Directory information to add some pretty cool dynamic asset identification and tracking. This means it can identify true hostname and OS information of the involved hosts to help an analyst confirm abnormal network behavior. These features make Darktrace different from a lot of other detection-centric network security tools because it’s looking for behaviors you see during a compromise instead of specific indicators.
It’s important to understand the ins and outs of Darktrace’s detection approach because it changes the way you triage those alerts. In short, you can think of Darktrace alerts as high-fidelity initial leads (for example, an anomalous connection / POST to PHP on a new external host) versus something more tactical and specific (like a Snort signature for a string in a specific PHP webshell). Both will likely detect the same known-bad activity. However, the Darktrace alert will likely detect far more unknown-bad since we’re not relying on constantly updated signatures to keep up with attacker TTPs. In any case, abnormal network events that are identified by Darktrace’s Enterprise Immune System are labeled as “model breaches” since they’re activity that has breached the known model of your network. That’s why we think of these alerts as initial leads. There’s something there … but it needs a little more looking into to understand exactly what it is. Fortunately, Darktrace provides a bunch of features to make this easy.
Our favorite Darktrace features
There are a ton of neat features in Darktrace. But if we had to pick three that our analysts find the most helpful in their day-to-day investigations it would be these:
- Advanced log search: Bro logs generated by Darktrace are indexed and accessible via a Kibana-like query structure. This allows us to quickly and efficiently scope an incident or hunt for threats across the entire organization without the need for exhaustive data collection and manual parsing by an analyst.
- Full packet capture: Custom, full packet captures can be quickly generated based on time and involved IPs. These “on-demand” packet captures are great for uncovering additional evidence that’s tailored, only including the required data and eliminating the need to filter large packet capture offline.
- Asset identification: Assets Darktrace identifies are enriched with Active Directory (AD) information including DNS hostname. You even have the option to customize tags to make valuable assets easier to identify. This feature helps analysts make quick decisions about the severity of a model breach assists in determining what further evidence may be available.
Detecting and investigating lateral movement with Darktrace
Attacks carried out by advanced attackers have one thing in common – lateral movement.
That’s because attackers almost never land on the box that has the data they’re after. To complete their mission they need to navigate to the endpoint where their desired data lives (that is, they’ve got to “move laterally”). There are only a few ways to do it and it can be difficult to spot with traditional network and endpoint tools. That’s why it’s a natural choke point when you’re detecting and investigating attacks (to learn more, check out the MITRE ATT&CK framework, which catalogs all of the ways attackers can move laterally).
Darktrace’s approach is well suited to uncover lateral movement. So let’s dive into a Darktrace “model breach” and look at how some of Darktrace’s key features help us effectively investigate a lateral movement technique that can be difficult to analyze using traditional IDS. The technique we’ll be examining is remote file copy over SMB.
Getting the lay of the land: the Darktrace search page
Before we dive into the alert it’s helpful to understand what’s going on behind the scenes in Darktrace. As you can imagine, SMB traffic is extremely common on most networks. That can make hunting through all the data a challenge – especially in a large environment. Fortunately, Darktrace has a few advanced search features that can help us.
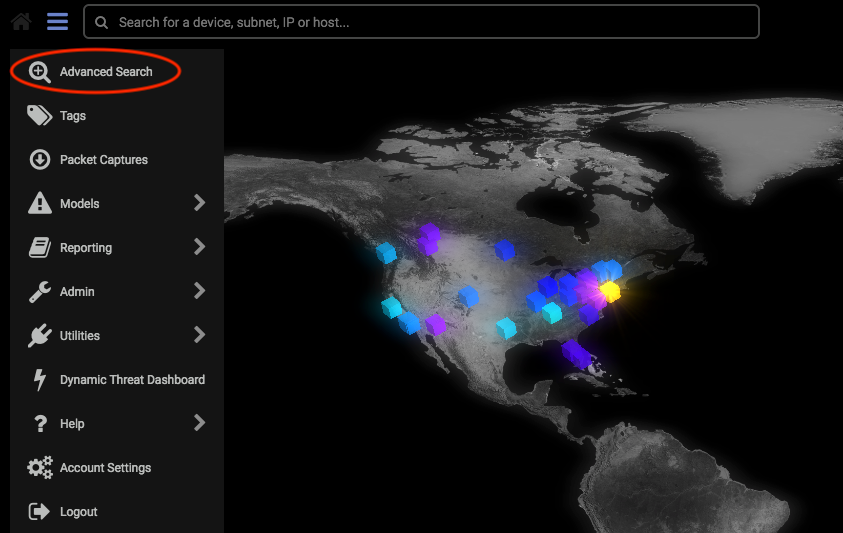
From the Darktrace homepage, let’s navigate to the advanced search page.
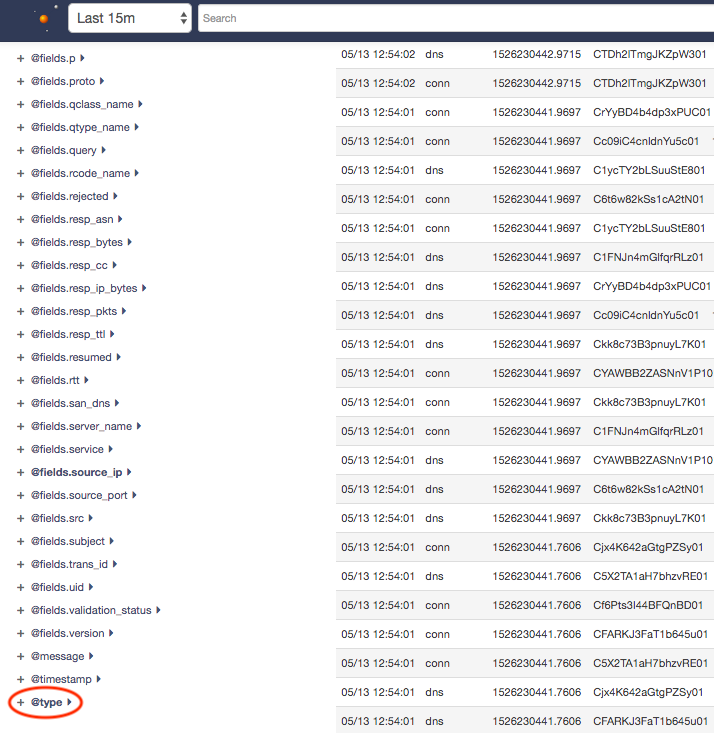
This is the view where I like to do most of my analysis. Essentially, it’s a Kibana-like representation of the Bro data that Darktrace has indexed. If you’re a security analyst, this is the view where you’ll run most of your queries to scope an alert, investigate or hunt. In this case, since we want to specifically investigate SMB traffic in the environment, let’s select a timeframe of last 15 minutes and select the @type field.
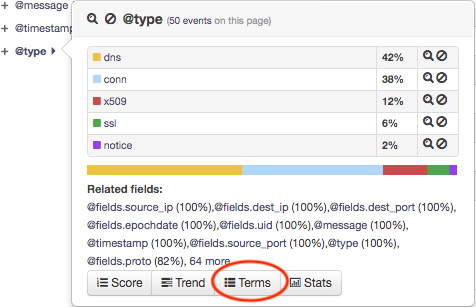
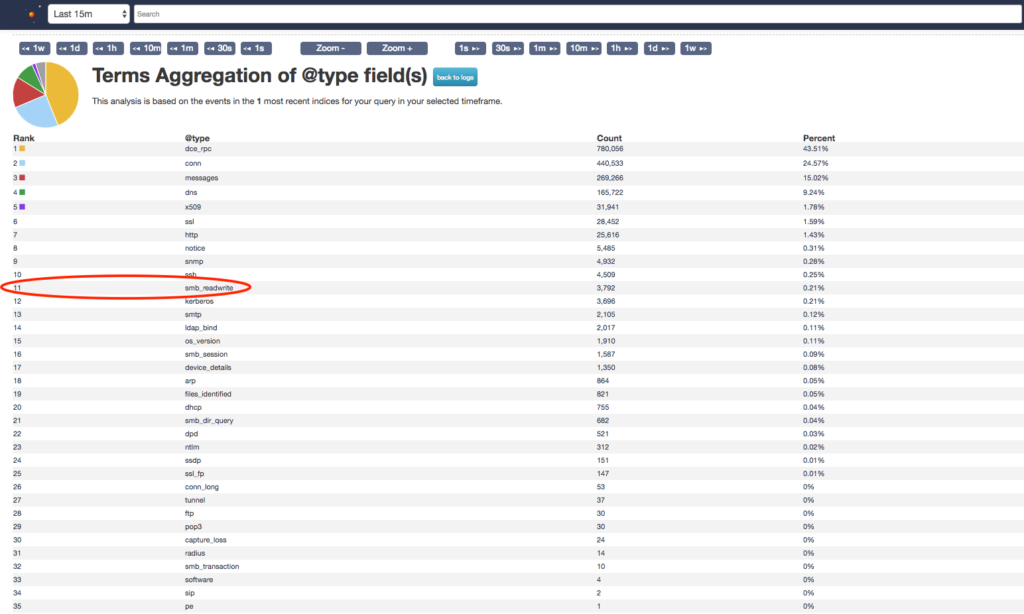
The type field allows us to tap into Darktrace analytics and see a table organized by the most commonly seen network protocols. Selecting the terms button, will give you to a complete list of this data.
Since we’re focusing on malicious file copy/execution via SMB, let’s check out the smb_readwrite category, since it’s where I’d expect to find this type of activity. As you can see, Darktrace does a really great job of parsing and stacking the Bro logs so it’s easy for an analyst to start identifying malicious activity. By applying a simple filter of @type:”smb_readwrite” and *.exe (or @type:”smb_readwrite” AND @fields.mime:”application/x-dosexec” to search by MIME type) we can identify any obviously named executables being transferred via SMB in a given timeframe. We’d expect to see a lot of legitimate traffic in these results since many enterprise applications handle deployment, updates and other administrative functions over the SMB protocol. As the screenshot below shows (not all results shown), we’re seeing CarbonBlackClientSetup.exe being transferred over SMB quite a bit in this environment. The high volume of activity combined with the large number of unique hosts involved means we can infer this is probably the result of legitimate admin activity, rather than an advanced attacker attempting to move stealthily through the environment.
In reality, this would be a pretty exhausting way to find malicious SMB transfers. But it’s a good, simple example of how we can use the Darktrace’s analysis features to start identifying malicious connections in an environment.
OK. Now that we’ve learned how to use some of Darktrace’s more advanced analysis features, let’s apply this knowledge to a Darktrace alert.
Investigating a Darktrace alert
Benign alerts are one of the most challenging types of alerts for a security analyst to triage. They’re also tricky to define. Here at Expel, we define benign alerts as ones where something matches the intention of the signature, but – after further investigation and gathering additional context – aren’t indicative of a security incident.
Since attackers often use legitimate tools, it usually boils down to concluding that a legitimate tool is, in fact, being used legitimately. As mentioned before, Darktrace’s Enterprise Immune System requires a learning period to identify what’s “normal” (and thus what’s “not normal”). Knowing this, we can assume that abnormal user traffic will likely trigger model breaches as the Enterprise Immune System begins to learn and identify events that match attacker behavior, even if they’re the result of legitimate user activity.
Step one: interpreting the model breach
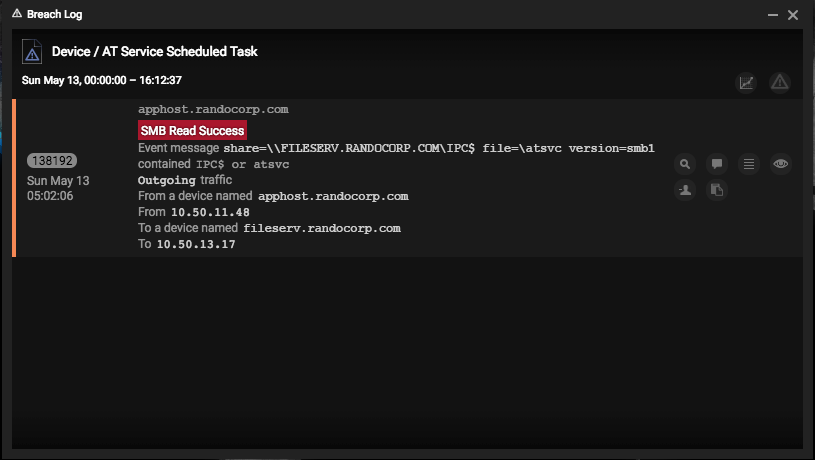
Staying with this thread of remote file execution via SMB, we can see this Darktrace alert was triggered via a violation of one of the pre-packaged model breaches for Device / AT Service Scheduled Task.
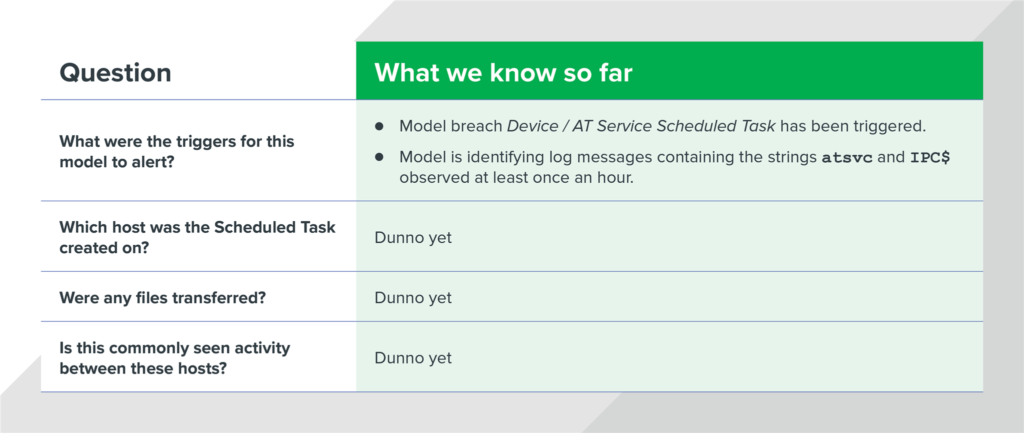
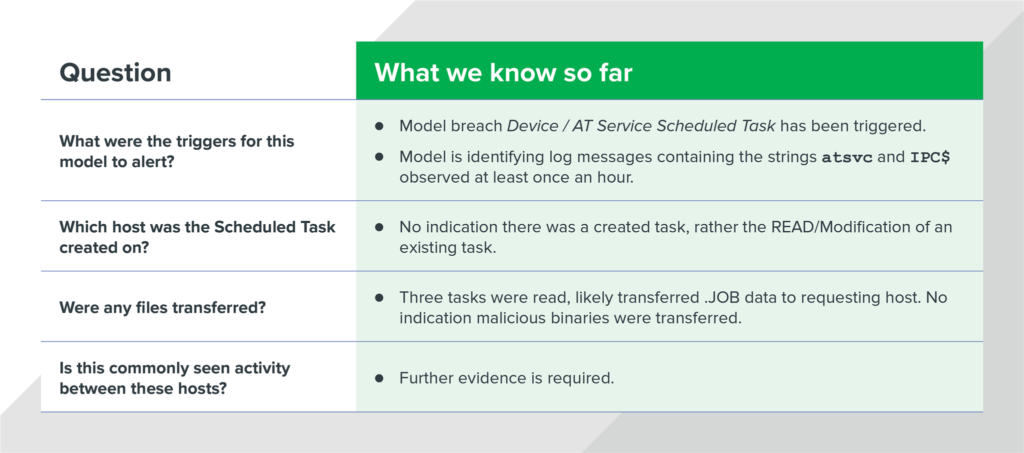
To triage this specific alert appropriately, we need to know answers to the following questions:
- What were the triggers that caused the model to alert?
- Which host was the Scheduled Task created on?
- Were any files transferred?
- Is this activity commonly seen between these hosts?
If we can answer these questions, we should be able to confidently determine whether or not this alert is related to malicious activity. But first, we need to gather additional evidence using the Darktrace console.
So where do we start?
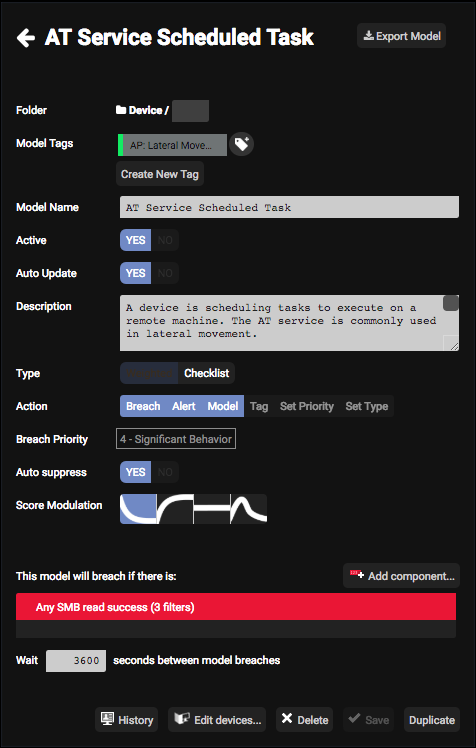
In my experience, it’s always best to start with what you know. At this point, we only know that the model breach Device / AT Service Scheduled Task has been triggered. But how do we know exactly what that means? Let’s view the model and explore the logic.
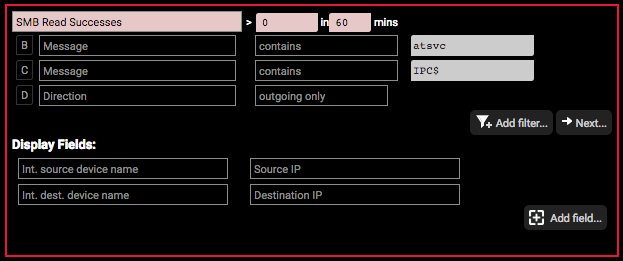
Looking at the logic behind this model breach, we can see that any message containing the strings atsvc and IPC$ will match this model breach. Since the frequency has been set to > 0 in 60 mins we can also assume that once this activity is seen exactly one time, it’ll trigger an alert. By understanding this logic, we now know:
Step two: chasing the initial lead
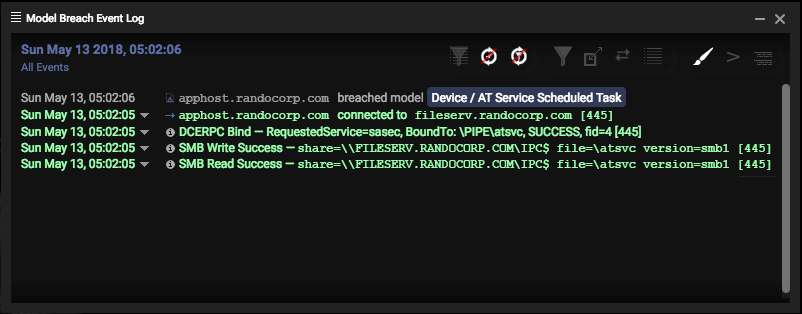
Now that we know what we’re looking for, let’s go grab some data. First, let’s explore the Bro log messages that triggered this model. To do this, open up the Model Breach Event Log. This shows us the related events that were observed for this model breach. As you can see below, there was a successful DCE-RPC bind, followed by SMB Write/Read success containing the keywords atsvc and ICP$.
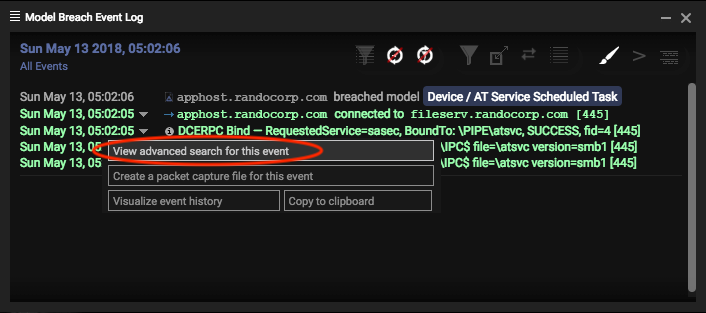
This is helpful. However, we’re interested in the surrounding context of these events. The quickest way to see this is to use the View advanced search for this event feature of the Model Breach Event Log as shown below.
Look familiar? Welcome back to the advanced search console. Now, let’s dig into the activity a bit more. As we discussed before, we know this model represents a common lateral movement technique using remotely scheduled tasks. By checking out the advanced search results for this model breach, we can get a better look into the context surrounding this activity.
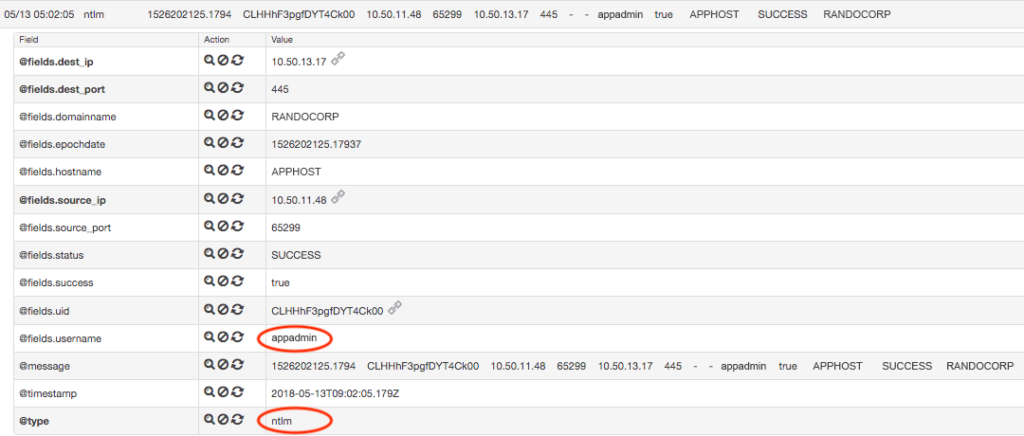
First, when we browse through the messages before and after the model breach alert, two distinct messages stand out. First, we see a successful NTLM authentication message for the account appadmin. Since NTLM is commonly used with SMB for authentication, we can infer this is likely the account being used by the source machine to establish the SMB session.
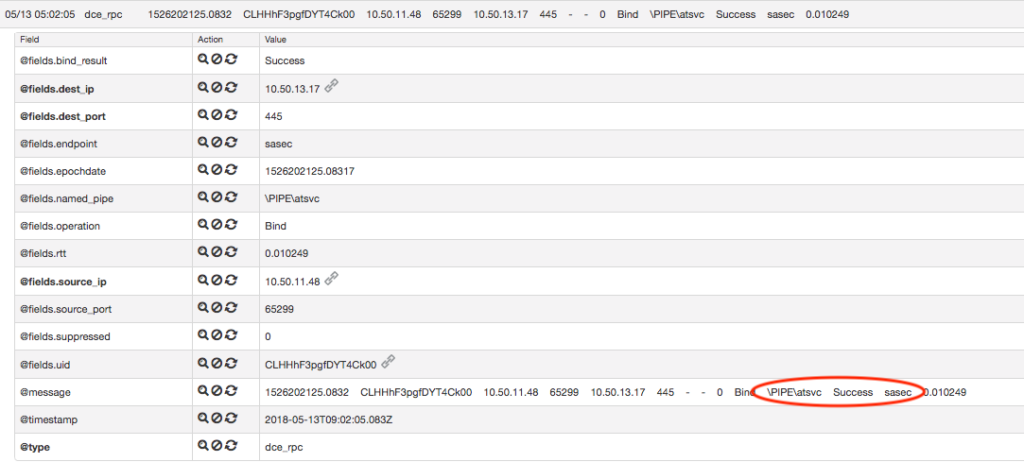
Immediately after this authentication we can see the following DCE-RPC message for a named pipe being created involving atsvc:
As highlighted in the above screenshot, we can also see that the RPC bind was created referencing the SASec interface. Using online resources to validate, we learned that the SASec interface “only includes methods for manipulating account information, because most SASec-created task configuration is stored in the file system using the .JOB file format” (https://msdn.microsoft.com/en-us/library/cc248269.aspx). What does that tell us? Well, we can infer that one possible explanation for this connection was that it was made to query information about a scheduled task defined within the .JOB format, rather than a new scheduled task being created on the host. However, within this model breach Darktrace doesn’t show any messages mentioning a file with the extension “.JOB”. This is where we can put the Darktrace advanced search back to work to find us some answers.
By querying “*.JOB AND SMB” within the timeframe of the activity we’ve already observed, some promising results start to appear.
As shown above, we observe three unique .JOB files being accessed over SMB during the exact time of our previous observations. Considering the hosts and the timeframe, we can correlate this activity to the original model breach.
With this observation, let’s consider what we know so far:
Step three: scoping additional evidence
So you might be asking yourself at this point, “How can we definitely prove this is non-malicious activity with only network data?” Well, it’s time to yet-again harness the power of Darktrace’s advanced search for some scoping fun.
Let’s take a second to consider what this activity would look like if it was malicious. AT jobs over SMB are used to execute something on a remote host. This means scheduling a task to run a malicious binary and establish persistence one time. However, we know that frequently in an enterprise environment, SMB is used for reading/writing files for the purpose of benign client-server communication. The frequency of such activity would be harder to identify without a quick way to query terabytes of log data, but with Darktrace we can scope months worth of records to analyze the frequency of such connections to identify anomalies within seconds.
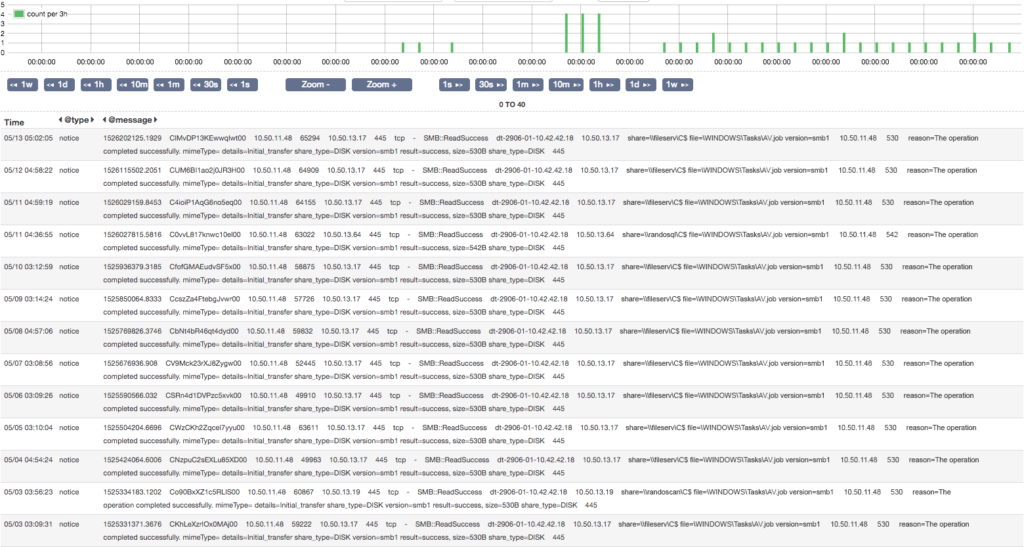
Let’s take one of our pieces of evidence AV.job and create a simple query to understand how frequently this activity occurs. Using the query “AV.job AND smb” over the past 60 days, the advanced search returns daily entries for identical activity going all the way back to April sixth. Notice, the activity occurs around the same time each day, involving the same hosts and file paths (data truncated for screenshot purposes).
Step four: Validation via packet analysis
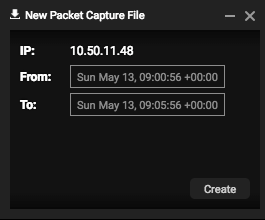
As an analyst, this is starting to smell like legitimate administrative activity to me. But the remaining sliver of doubt that I have lies within the ability to analyze the contents of the requested file AV.job. One of the other great features of Darktrace is it’s full packet capture capability. With this, we are able to grab a custom PCAP based on the data observed in a model breach, or at random by specifying a source IP address and timeframe of interest. Using this capability, I created a packet capture for a five-minute window around the timeframe of the source IP address observed in the model breach.
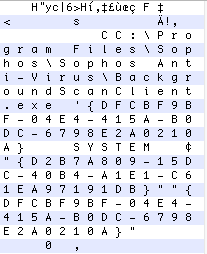
Once I collected the PCAP, I downloaded and analyzed it in Wireshark. Fortunately, Wireshark was able to extract transferred files within this SMB session using the Export Objects feature. Using a hex editor, we can see the contents of AV.job.
As you can see, the contents of this file refer to an executable in the location C:Program FilesSophosSophos Anti-VirusBackgroundScanClient.exe. Judging by the name of the .JOB file this was found in, we can infer it’s likely a legitimate scheduled task created to perform an antivirus scan on the endpoint each morning. This doesn’t rule out the possibility this binary has been replaced with a malicious executable with the same name/path. But as far as network evidence goes, Darktrace has helped us generate solid leads that can take us to the endpoint for further validation.
Reviewing our original analysis questions, we are now able to confidently answer all 4 questions.
Conclusion
We often find that network detection is really effective at generating leads by uncovering suspicious activity. Being able to effectively use an investigative platform like Darktrace allows an analyst to quickly confirm and scope potential threat activity and identify network based indicators (NBIs) related to an attack. It can also help generate additional host based indicators (HBIs) to supplement your investigation. In short, effectively using the Darktrace advanced search and other features to discover model attacker activity highlighted in the MITRE ATT&CK framework, is a sure-fire way to enhance your organization’s response and hunting capabilities.


